The Volatility of Volatility
June 1, 2024
The Markets at a Glance


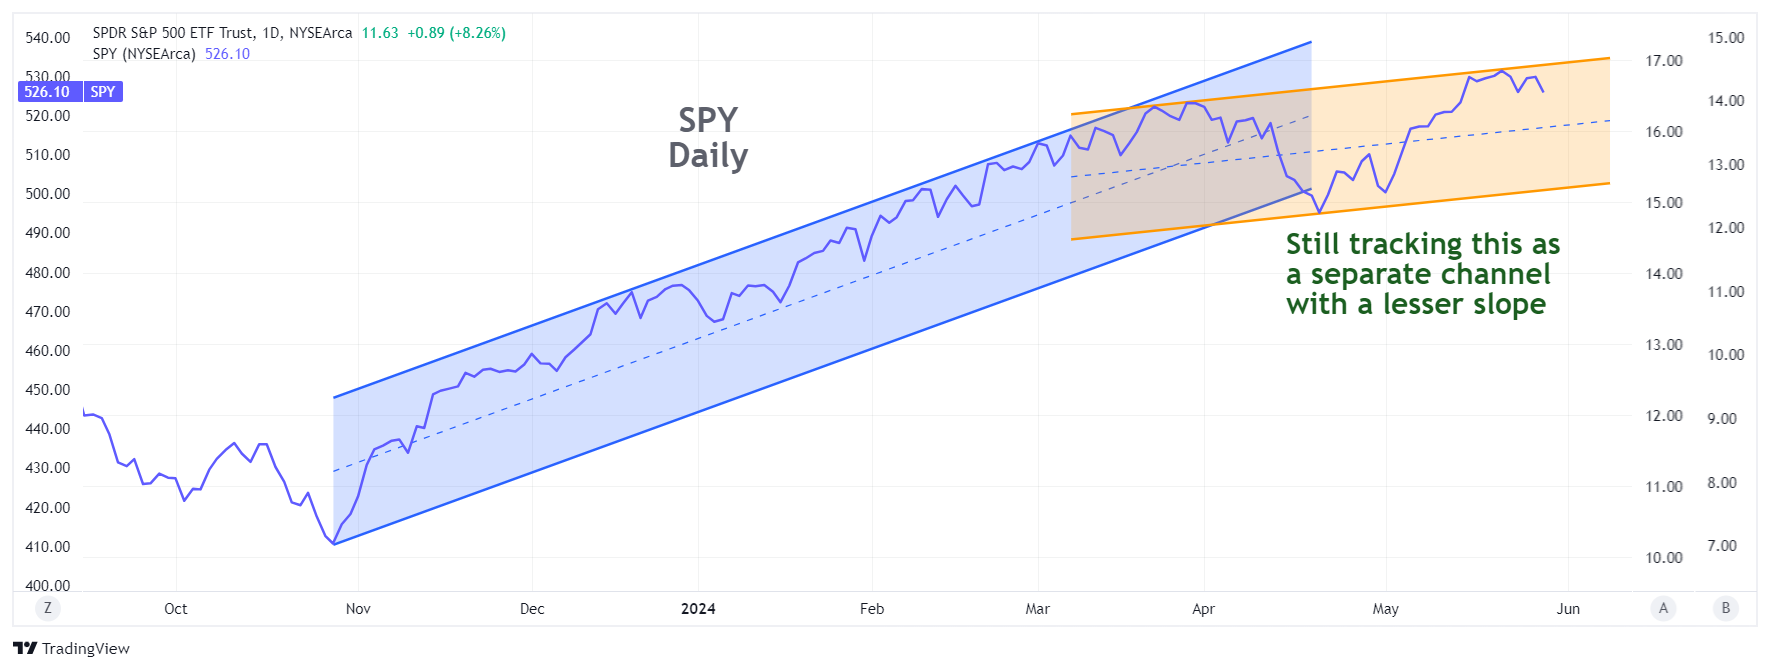
SPY and QQQ have rolled down off their recent highs, lending additional confirmation to the scenario presented above, whereby the uptrend from 2023 is seen as having transitioned over the past two months to a trend that remains upward but at a lesser slope. The drop this week (SPY from 533.07 to 522.63, and QQQ from 459.74 to 451.55) as of Thursday's close aligns with that scenario as both indexes have hit recent highs that were higher than April's highs but lower than they might have been if the indexes were continuing to advance at the same pace as the original rally from last October.
Given the fact that inflation remains above target and the Fed remains uncommitted on rate cuts, it is not surprising that the markets would back off from the optimistic pace of the first quarter. Additionally, first-quarter GDP growth slowed to 1.3% from 1.6%, and corporate profits declined 0.6% on an annualized basis last quarter, the first drop in a year. Some of the AI froth in companies such as Nvidia (NVDA) has simmered down, and software companies UiPath (PATH) and Salesforce (CRM) were punished for disappointing projections.
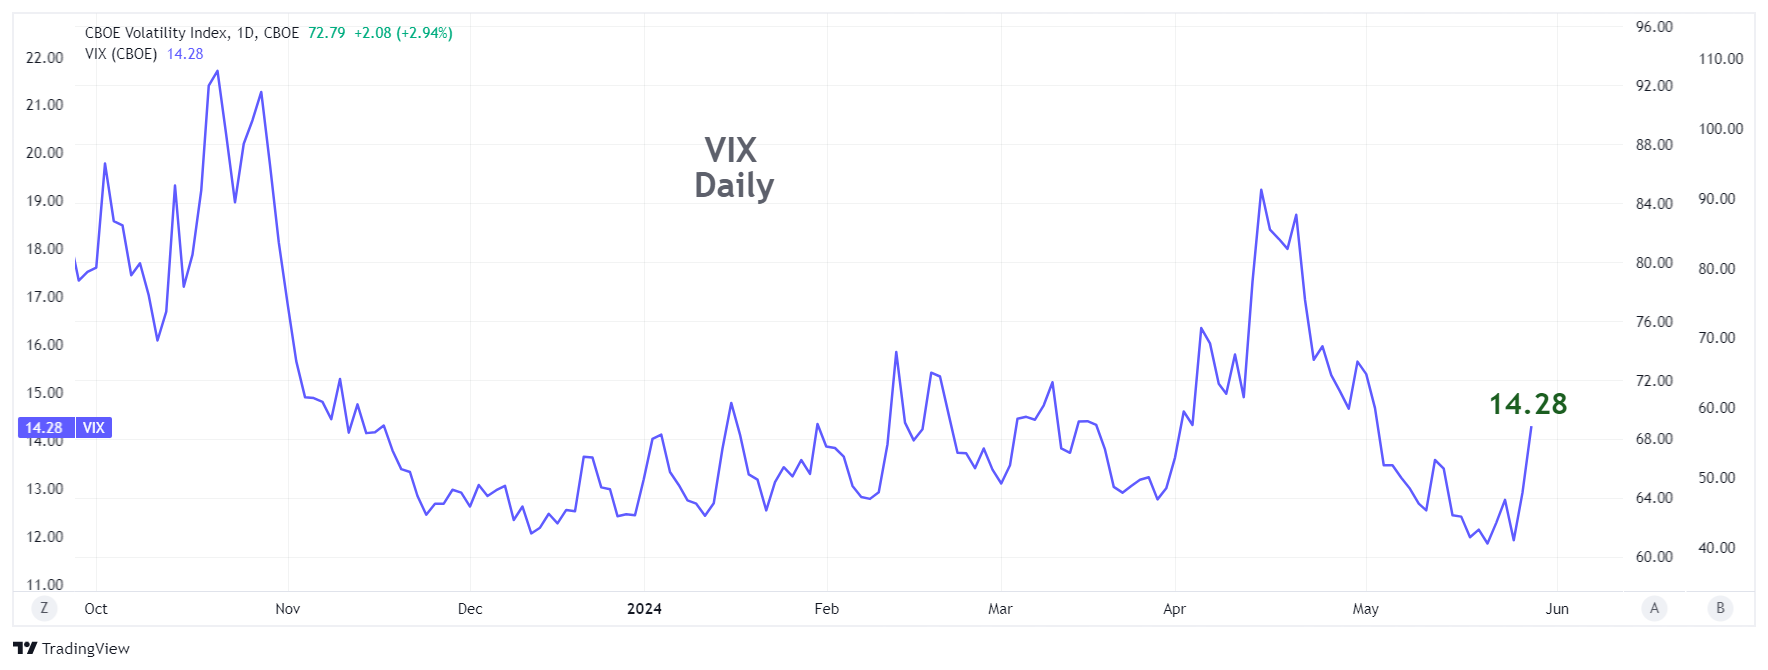
At the same time, VIX lurched upward from its 5-year low last week at 11.87 to more than 14. That may not be a terribly ominous signal just yet, but it suggests that there has been an increase in demand for puts on the S&P index - the common reason why that index rises.
Plus, of course, summer has begun. You can say what you want about any given year being an exception, but the long-term performance results in May through October are dramatically lower than those of November through April.
And then there is the election, which brings me to this week's strategy talk about volatility.
Strategy talk: The Volatility of Volatility
Volatility has some very unique characteristics. We might be tempted to find them 'quirky', but since implied volatility is such an important consideration in options trading, we need to take them seriously.
For one thing, not just the implied volatility but the actual historic volatility of any stock varies over time, sometimes extensively. It can be affected by the nature of a company's business, the perceptions surrounding its business, its leadership, competition, earnings consistency, and a host of other factors. If you were to track any stock's 90-day historic volatility over time (which only a few sources such as IVolLive do), you would see variations throughout the year that would likely surprise you.
You can see from the above graph of the CBOE volatility index ($VIX), that implied volatility on the S&P 500 index varied between a low of 11% and a high of 22% since last October. That, of course, is much more muted than the volatilities of most individual stocks by themselves, which are more commonly between 20-60% or more.
While we can observe the implied volatility of any individual stock at any time by using its near-term at-the-money call option, we can gauge the overall level of implied volatility on the market through VIX and VIX offers us something the individual stocks do not - futures and options trading on the index itself. Thus, we can see the expected implied volatility of VIX (the volatility of volatility) into the future. A calculation could be made on any individual stock based on implied volatilities of more distant options but it is more readily visible on VIX through VIX options.
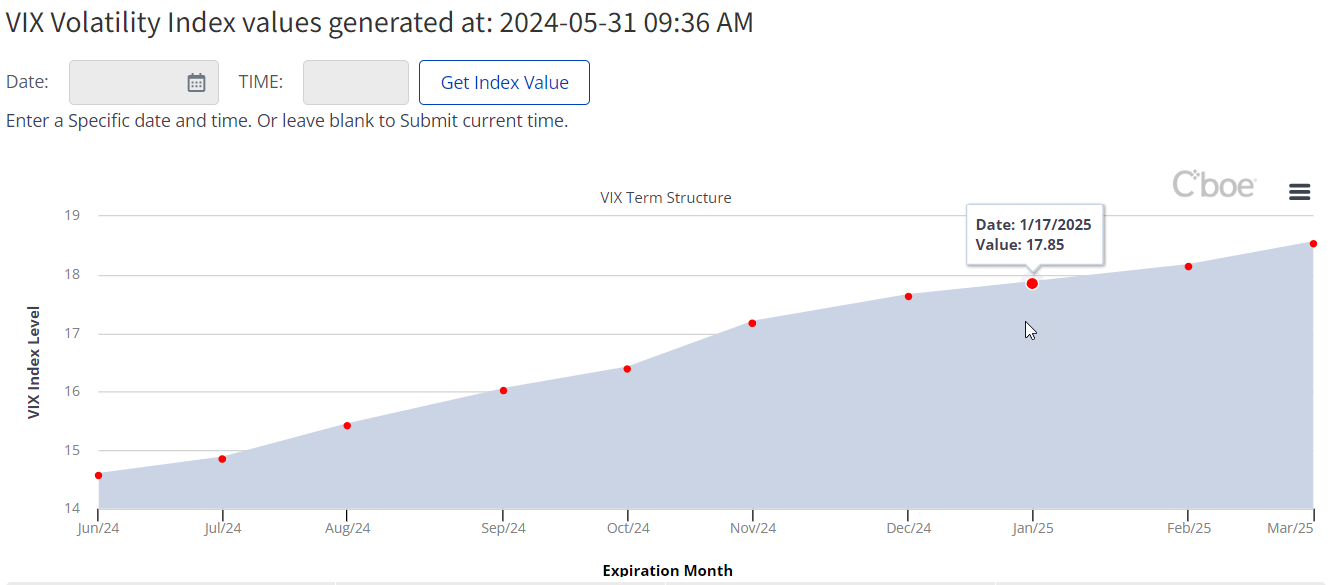
So, not only can we see how volatile the VIX index is, we can use the VIX futures to create a 'term structure' for VIX into the future, just like any other item on which futures are traded. A snapshot of the term structure from the CBOE web site is shown below.

From this chart, we can see that VIX is anticipated to be as high as 18.5 by March 2025, according to futures prices at the current time. Given its recent 5-year low, its propensity to spike upward at any time, and an upcoming national election in the US, this pattern does not seem all that surprising. Over time, as the current level of VIX fluctuates, the term structure does as well, vacillating between a rising and declining curve at different times.
Before you buy or sell a VIX option, however, be aware that a few expirations (the monthlies) have good volume and liquidity, while others (weeklies and more distant months) have very poor liquidity. The expirations with good liquidity are June 18th, July 17th, August 21st, and September 18th. You will also see that the implied volatility (as determined by the ATM call in those expirations) rises over time from about 63% in June to 79% in September. It goes even higher (over 100%) in the October expiration due to the election, but there is very low volume and the IV is less reliable. (All numbers are from the May 30 closing prices.)
Note: IVolLive is one of the few sources where you can track or screen for historic volatilities over different periods of time. Check out our video How to Access, View, and Analyze Historical Volatility in IVolLive.
Got a question or a comment?
We're here to serve IVolatility users and we welcome your questions or feedback about the option strategies discussed in this newsletter. If there is something you would like us to address, we're always open to your suggestions. Use rhlehman@ivolatility.com.
Previous issues are located under the News tab on our website.