Great Expectations
October 31, 2022
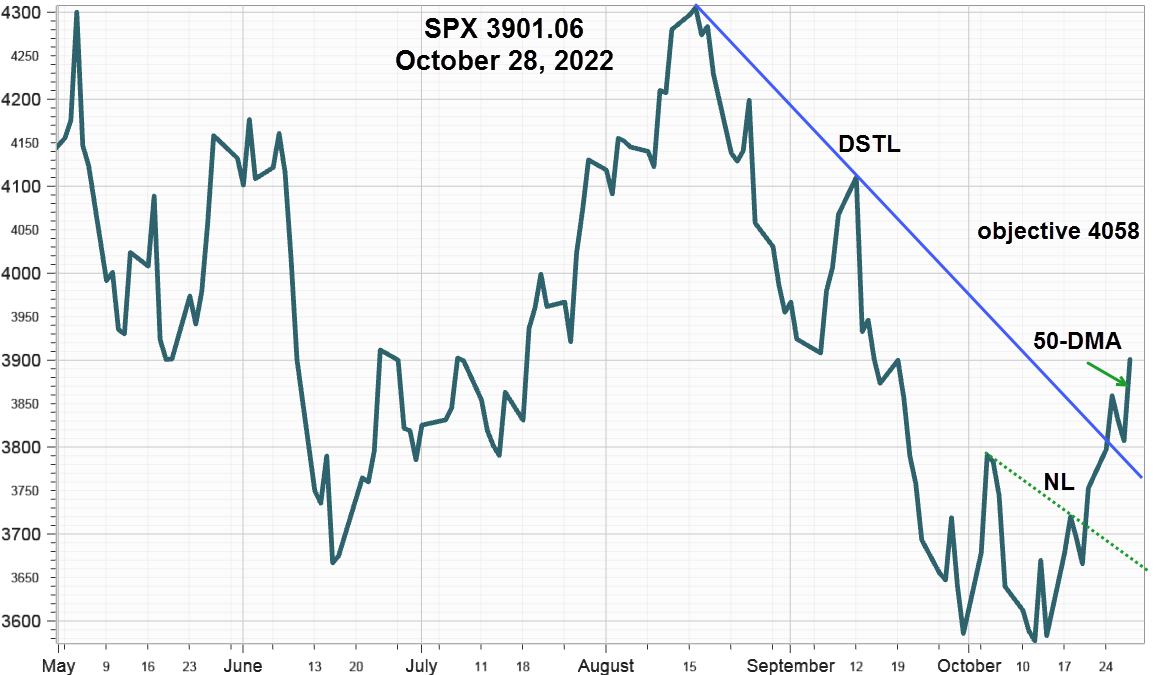
Expectations that the Federal Reserve will confirm its intentions to slow the pace of rate hikes after the November meeting on Wednesday boosted the S&P 500 Index enough to close above three important technical indicators. Evidence that the tide turned began last Monday after it closed above the neckline of a small Head & Shoulders bottom pattern from the Key Reversal low at 3491.58 on October 13.
S&P 500 Index (SPX) 3901.06 gained 148.31 points or +3.95% closing above the 50-day Moving Average at 3842.01, the downward sloping trendline from the August 16 high at 4325.28 (blue line) and the neckline (green dotted line) that defines a small head & Shoulder Bottom with an upside measuring objective at 4058. Since the record shows more market bottoms occur in October than any other month it appears this year could add another to the tally. However, any further advance toward the upside objective will need help from the Federal Reserve by slowing rate hikes as the markets expect.

Interest Rates
For the week, the 10-Year Treasury Note ended at 4.02% down 19 basis points (bps). The 2-Year Note slipped 8 bps to end at 4.41% for a 10-2 inversion of -39 compared to -28 the week before. However, the 3-month Treasury Bill rate increased to 4.18% up 9 bps.
The long end of the bond market provided the help needed by equities to advance despite significant rotation out of big cap favorites after reporting earnings.
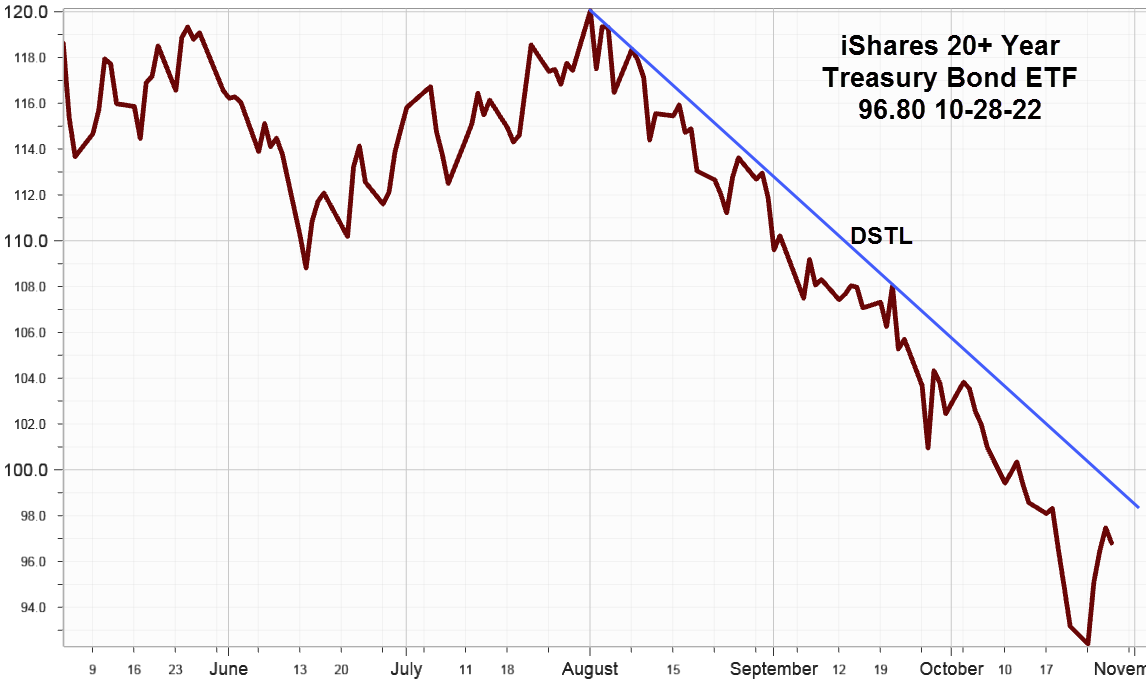
iShares 20+ Treasury Bond ETF (TLT) 96.80 gained 3.63 points or +3.90% last week after a steep decline into oversold territory the week before. The yield declined 16 bps to 4.38% down from 4.54%.

While still below the downward sloping trendline (DSTL) the recovery from the week before supported equities along with help from a pullback in the U.S Dollar Index (DX) 110.61. Although the pace of rate increases may slow, they have yet to peak so TLT may have trouble ending this downtrend anytime soon.
Market Breadth as measured by our preferred gauge, the NYSE ratio adjusted Summation Index that considers the number of issues traded, and reported by McClellan Financial Publications added 75.62 points for the week ending October 21 then accelerated last week adding another 300.56 points to end at -732.25; confirming the strength of the broad market October bounce without help from many big cap favorites.
Implied Volatility
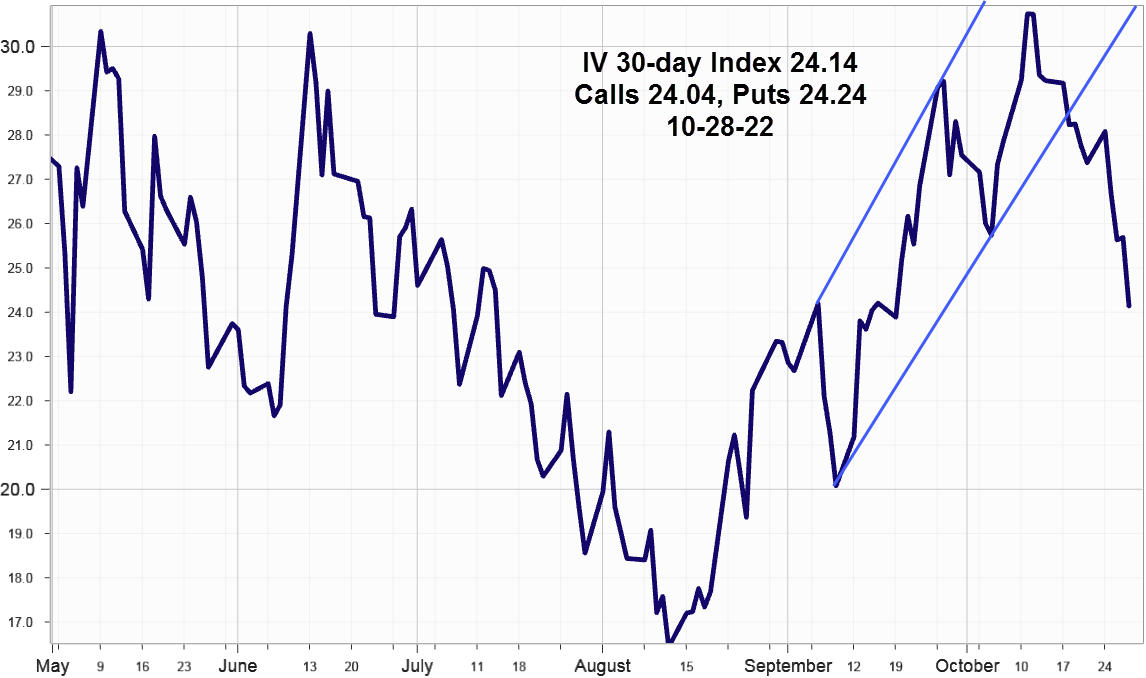
SPX options implied volatility index, IVX slipped 3.24% last week to end at 24.14 with Calls at 24.04 % and Puts at 24.24% well below the blue parallel lines forming an upward sloping channel after reaching a 52-week high at 30.74% on October 11, 2022. It's now headed lower as SPX advances toward the upside objective.

Summing Up
The October bounce that began on Friday October 21from short covering and hedge unwinding continued last week as the markets, both equities and bonds expect Fed may consider slowing the pace of rate hikes after the November FOMC meeting this Wednesday. One astute analyst claimed the markets are trading the Fed not the economy.
While the S&P 500 Index closed above three technical indicators it will need the Fed to confirm a slowing change in pace of rate hikes to continue up to the objective at 4058, although some "buy the rumor sell the news" on Wednesday could slow the advance somewhat.
Breadth improved markedly and implied volatility continue lower supporting the view that SPX will soon reach the upside objective for the October bounce. However, any further advance depends on the Treasury bond market.