Crosscurrents at the Top
By Fauzia Timberlake, personal coach for trading options
November 2, 2026
Macro Overview of Markets
Defining Catalyst: A Heavy Central Bank & Big Tech Earnings Crosscurrent
The primary catalyst governing capital market movements during the week of October 26–30, 2026, was an intense clash between global monetary policy outcomes and high-stakes mega-cap technology earnings.
The Federal Reserve—alongside the European Central Bank and Bank of Japan—decided to hit pause on rate changes. However, policymakers signaled an ongoing cautious stance, keeping short-term benchmark rates elevated. This rate pause initially stabilized markets, but a late-week sell-off was triggered by severe reactions to semiconductor and mega-cap tech earnings disclosures. Disappointing prints and cautious forward guidance across major chipmakers and cloud giants sparked a sharp de-risking event on Friday, dragging growth indices down and dictating overall market direction.
Major benchmark indices finished the week mixed-to-lower, heavily pulled down by late-week tech weakness. For the week, the S&P 500 fell 0.57%, the Nasdaq Composite slid 2.00% and the Dow Jones Industrial Average dropped 0.85%. Interestingly, small-cap equities (Russell 2000) outperformed large-cap tech, advancing +1.29% for the week as capital rotated away from concentrated growth into broader value and defensive pockets.
(S&P 500 Close: 7,580.07)
Despite the U.S. Treasury conducting a massive, record-setting $839 billion debt auction across 11 issuance windows during the week, fixed-income prices rallied into the weekend. The 10-Year U.S. Treasury yield eased off its midweek highs above 5.00%, falling back down as investors sought safe-haven duration during Friday's equity sell-off.
(10-Year Treasury Yield Close: 4.93%)
Energy markets experienced continued upward momentum driven by Middle East geopolitical supply concerns. WTI Crude traded near 103–117 parameters, marking its third consecutive weekly gain and keeping cost-push inflation fears active across macro allocations.
(Crude Oil Close: $103.43)
Precious metals faced selling pressure as elevated benchmark yields and a stable U.S. dollar kept non-yielding assets under constraint. Spot Gold dropped over 4% on the week.
(Gold Close: $3,995.40)
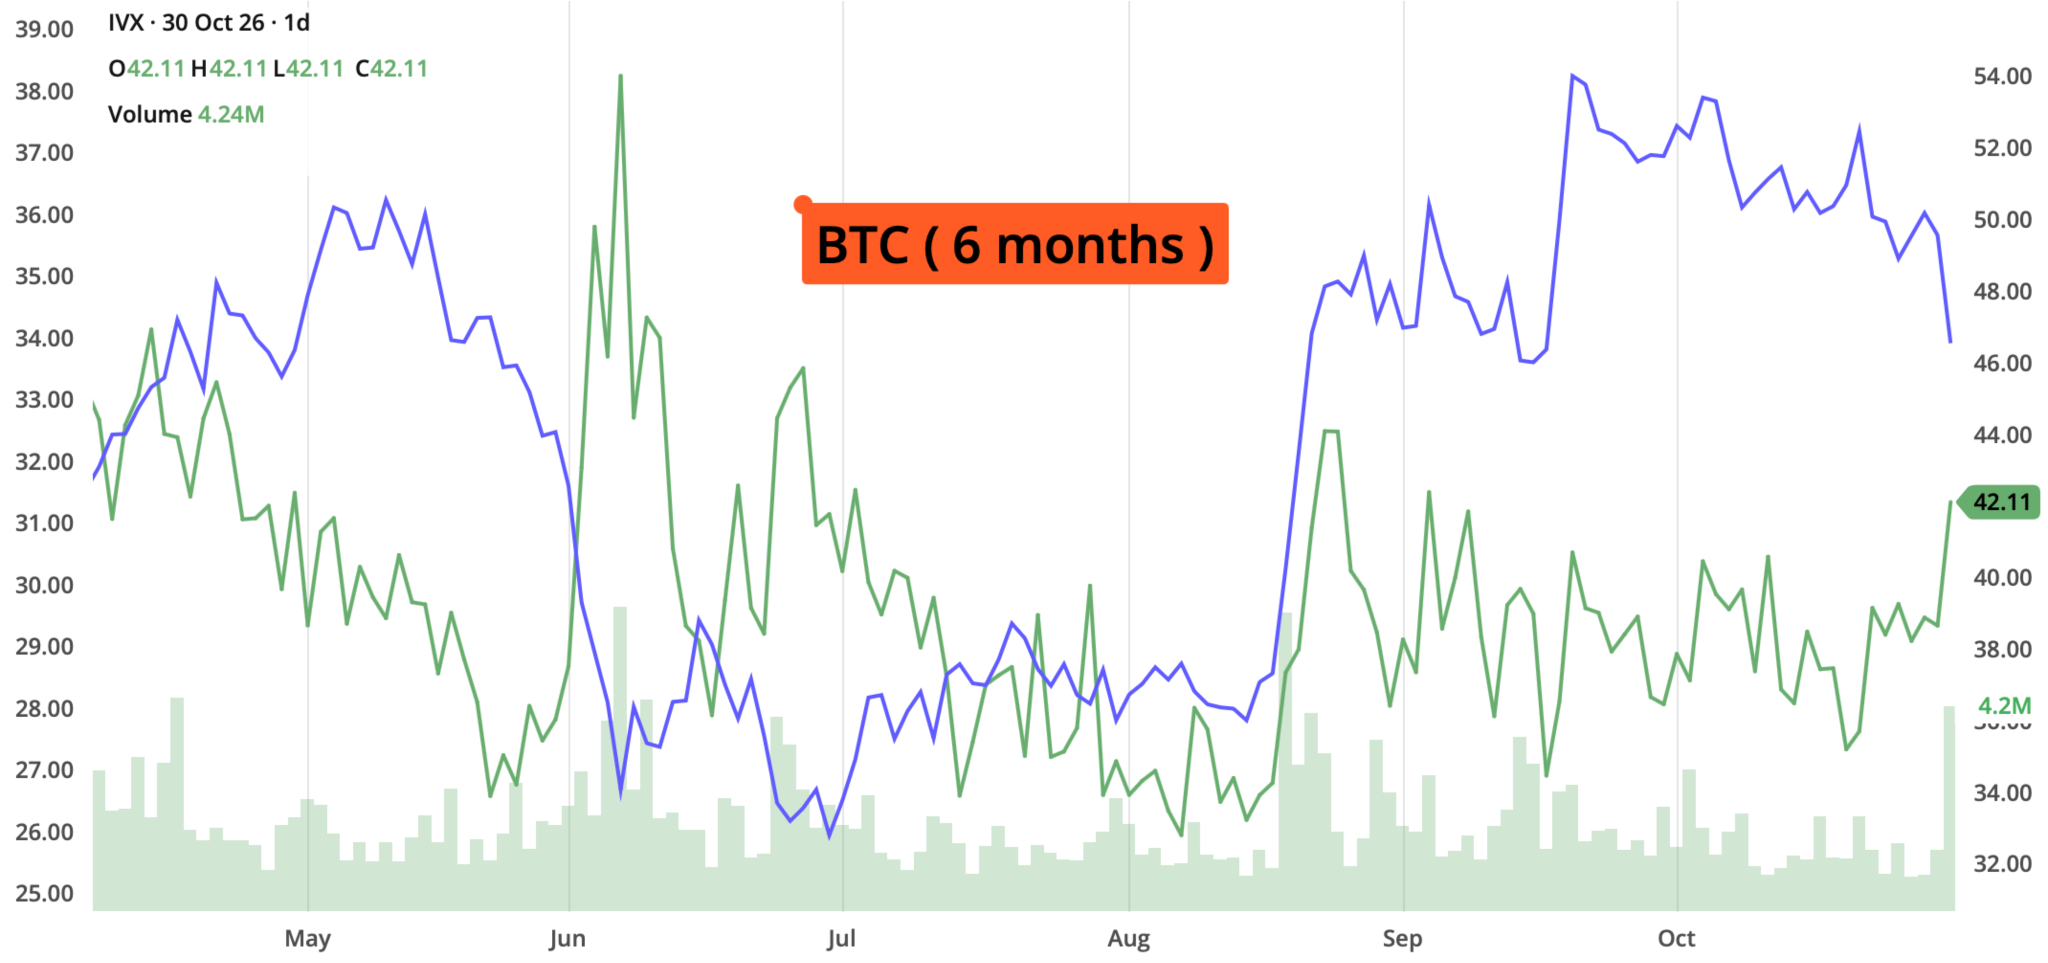
High-beta crypto assets tracked the late-week broader tech retrenchment. Bitcoin (BTC/USD) experienced downside consolidation alongside the pullback in risk assets, with Bitcoin spot products (such as IBIT) declining over 5% into Friday's close as broader market liquidity tightened.
(Bitcoin Close: $77148.53)
Strategy Corner
Based on last week's market movements, here are some trading ideas and option strategies for the readers' consideration. The positions can be scaled bigger (or smaller) to suit individual account size.
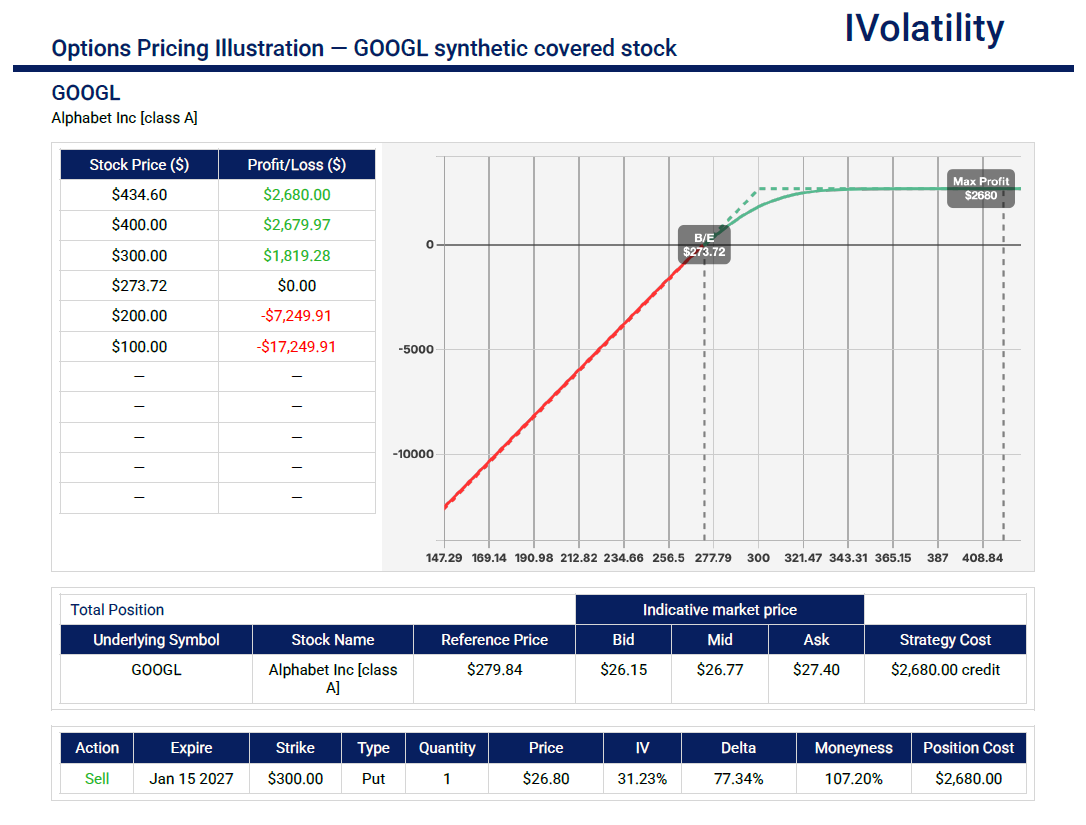
GOOGL (closed around 279.69 on Friday, Oct 30th)
Profit margin compression and surging AI capital expenditures, GOOGL shares dropped nearly 13% following a disappointing earnings report last week.
If a trader would like to be bullish in GOOGL for the next 76 days, a synthetic covered stock position could be considered. By selling the ITM $300 Put, the position establishes a synthetic long/covered stock exposure and provides a systematic, capital-efficient alternative to buying 100 shares of underlying stock and selling an out-of-the-money call (covered call). This structure captures a substantial delta, benefits from positive theta decay, and offers a strong probability of profit while tying up significantly less capital than a standard 100-share long position.
- Structure: synthetic covered stock
- Position: In the Jan monthly expiration, sell the ITM 300 put
- Probability of Profit of about 57%
- Credit collected about $2700/contract
- Breakevens at around 273 (just below where the stock closed on Friday)
QQQ (closed around 690.53 on Friday, Oct 30th)
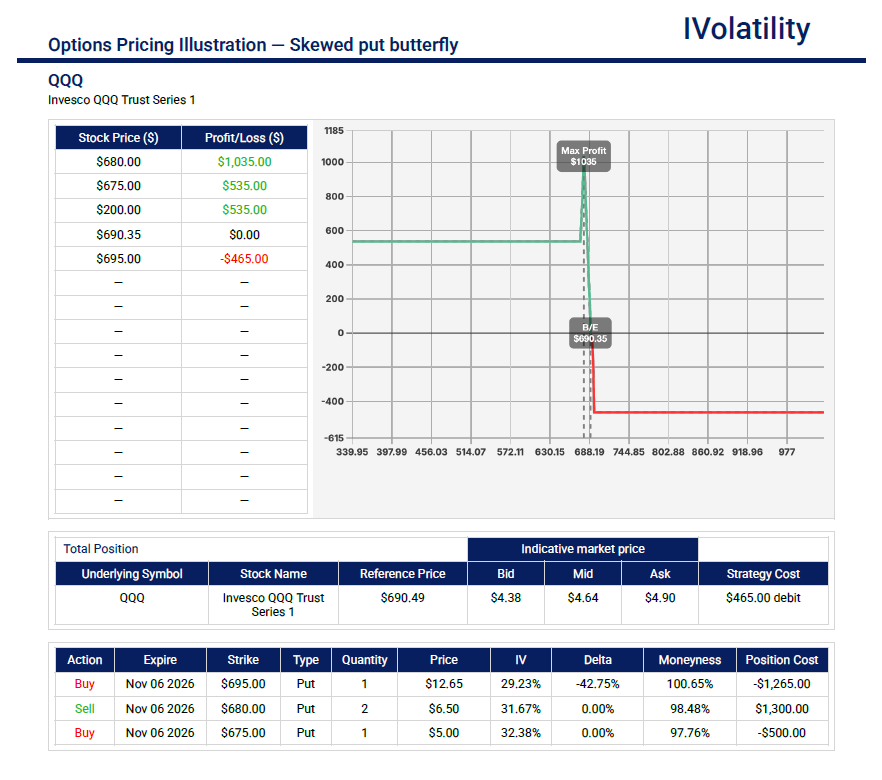
If a trader anticipates that markets might be disturbed during the week of the mid-term elections in the US, a hedge could be employed using a skewed put butterfly. By paying a modest additional net debit relative to a standard symmetrical butterfly, the position is structured so that the long put leg's value offsets or exceeds the net debit paid if QQQ suffers a catastrophic sell-off—effectively eliminating downside risk below the lower strikes while capturing maximum profitability inside the expected downside volatility zone.
- Structure: skewed put butterfly
- Position: In the Nov 6th expiration, buy one 695put / sell two 680puts / buy one 675 put
- Total cost of about $465
- Maximum potential profit $1035 (1500 - 465) if QQQ pins 680 at expiration
- No risk to the downside
Movement of the Major Market Indices:
| INDEX | UP | DOWN |
| SPY | -0.56% | |
| QQQ | -1.97% | |
| IWM | 1.29% | |
| DIA | -0.85% | |
| GLD | -3.47% | |
| BTC/USD | -3.80% | |
| 10-year yield | -1.20% | |
| Crude Oil | 1.55% | |
| VIX | -0.15% |
Movement of the Major Market Sectors:
| SECTOR | UP | DOWN |
| TECH (XLK) | -1.80% | |
| FINANCIALS (XL) | 0.84% | |
| INDUSTRIALS (XLI) | -0.53% | |
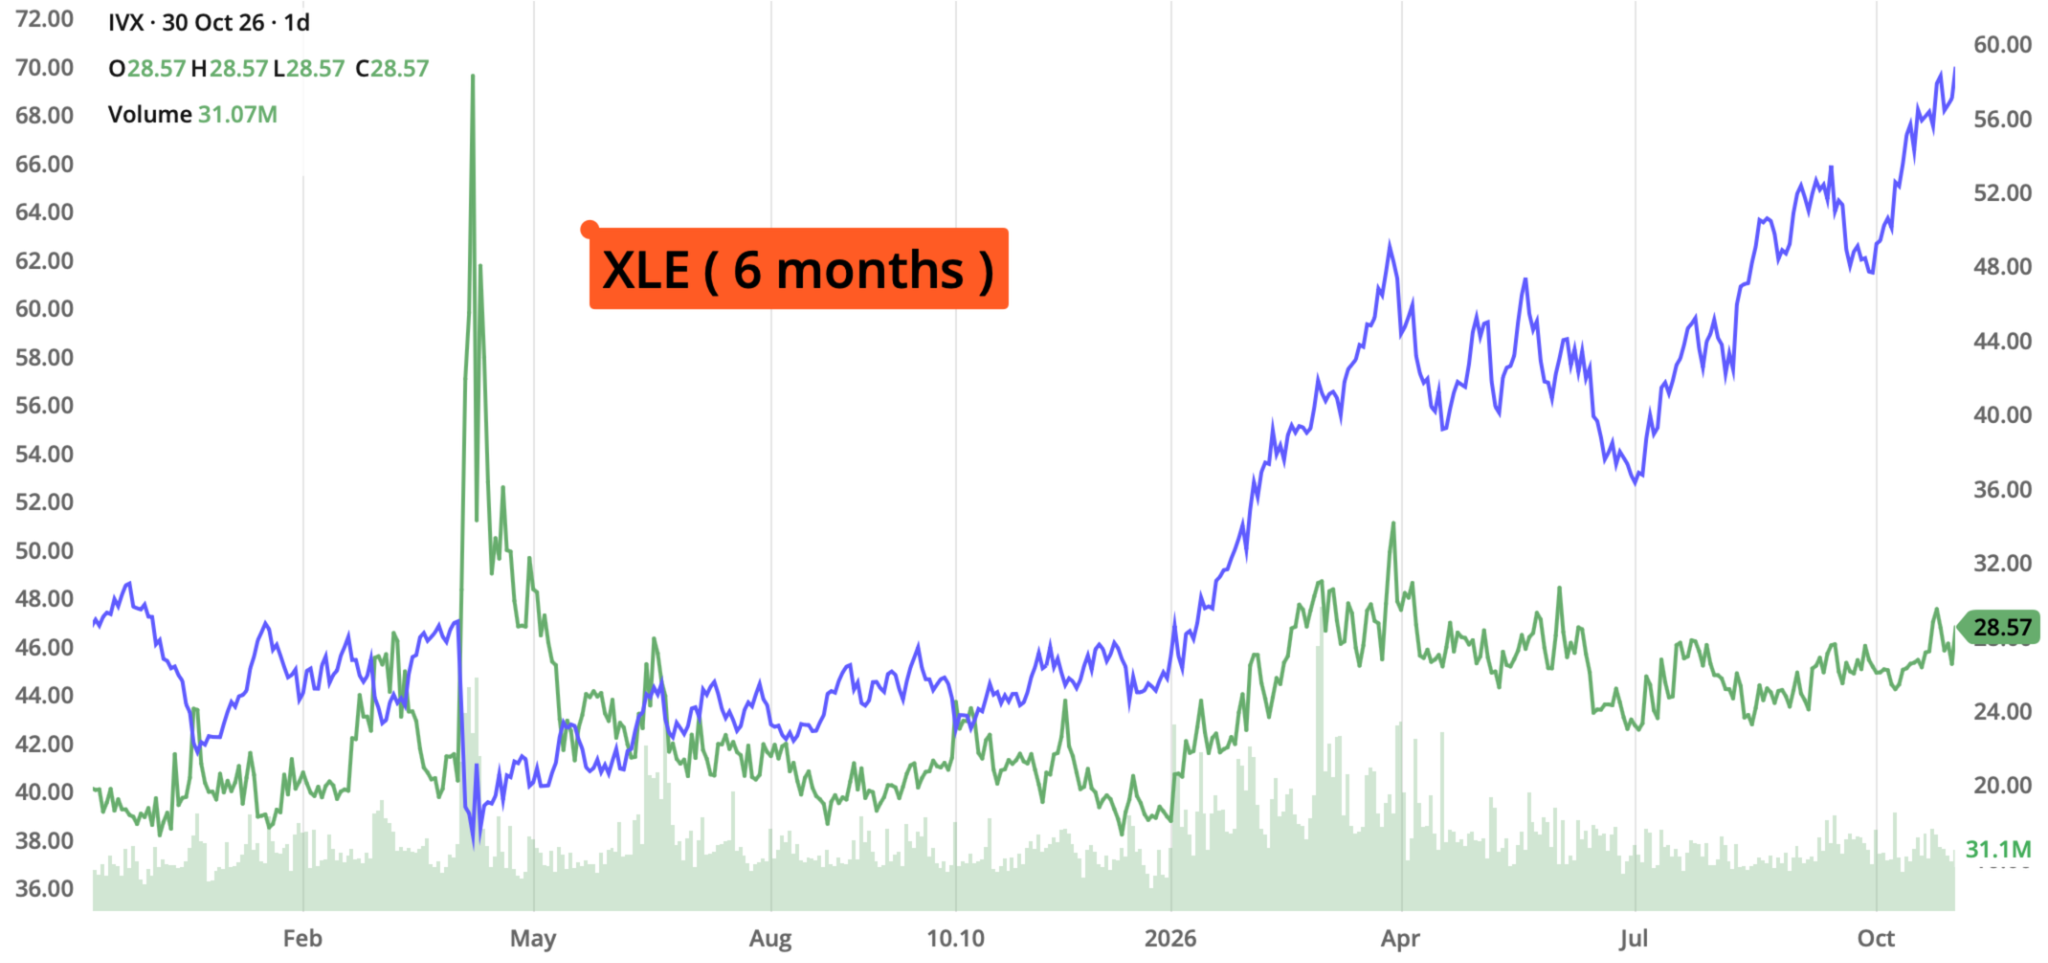
| ENERGY XLE | 3.42% | |
| HEALTHCARE (XLV) | 3.14% | |
| UTILITIES (XLU) | 2.01% | |
| MATERIALS (XLB) | 0.45% | |
| REAL ESTATE (XLRE) | 1.35% | |
| CONSUMER STAPLES (XLP) | 1.22% | |
| CONSUMER DISCRETIONARY (XLY) | -1.65% |
Notable Gainers Week of Oct 26th – 30th
Despite late-week equity market turbulence and tech sector volatility, capital rotated heavily toward energy producers, resilient financial providers, healthcare innovators, and select consumer leaders. Driven by WTI crude surging past $103 per barrel and strong third-quarter earnings disclosures, companies with robust pricing power, cash-generative balance sheets, or positive earnings surprises attracted strong institutional buying. Below are notable high-volume market leaders that posted significant weekly gains, ordered from largest percentage gain to smallest.
- Regeneron Pharmaceuticals Inc. (REGN): Advanced over 13% for the week, leading large-cap gainers following a standout quarterly earnings beat driven by strong global demand for its core commercial oncology and immunology franchises.
- FedEx Corp. (FDX): Surged over 11% over the period as operational efficiency gains and favorable freight pricing metrics offset broader macroeconomic cost concerns.
- Global Payments Inc. (GPN): Climbed nearly 10% on the week, benefiting from positive quarterly transaction volume growth and expanding merchant payment processing margins.
- Chevron Corp. (CVX): Rose 6.5% across the session as surging crude oil prices and robust cash flow disclosures boosted energy sector allocations.
- Exxon Mobil Corp. (XOM): Gained nearly 6% for the week, tracking the upward momentum in upstream energy assets as institutional capital sought defensive inflation hedges.
Notable Losers Week of Oct 26th – 30th
A sharp late-week tech liquidation, persistent geopolitical friction in crude oil markets, and sticky Treasury yields combined to weigh on high-beta growth components, chipmakers, and transport stocks. With WTI crude pushing firmly above $103 per barrel and benchmark borrowing costs remaining elevated near 5.00%, corporate input costs and high-capex infrastructure initiatives faced acute profit-margin headwinds. As institutional capital defensively rotated away from mega-cap growth and semiconductor hardware, several high-volume, large-cap market leaders experienced significant weekly pullbacks.
- Qualcomm Inc. (QCOM): Dropped 12% on the week, leading large-cap decliners lower as broader semiconductor de-risking and cautious forward demand metrics across mobile handset licensing triggered aggressive institutional selling.
- SpaceX (SPCX): Fell nearly 11% on the week as market participants digested headline risks and governance questions surrounding potential corporate restructuring discussions with Tesla.
- Meta Platforms Inc. (META): Declined nearly 9.5% over the period as heavy capital expenditure commitments for AI infrastructure and cloud capacity prompted investors to harvest profits in mega-cap communication services.
- Broadcom Inc. (AVGO): Retreated over 7% on the week as broader chip sector weakness and valuation sensitivity pulled high-multiple enterprise semiconductor names lower.
- Alphabet Inc. (GOOGL): Slid 6.0% for the week following post-earnings volatility, as conservative forward margin commentary overshadowed steady enterprise cloud expansion.
Review selected market indices below:
Daily Notable Market Action
Market Summary for Monday, Oct 26th
Equities: Equities opened the week with broad-based gains as mega-cap tech shares rebounded following the prior week's late liquidation, led by strength in semiconductor and automotive shares. (S&P 500 Close: 7,676.77)
Bonds: Benchmark Treasury yields drifted slightly lower as bond markets stabilized ahead of the upcoming central bank rate decisions. (10-Year Treasury Yield Close: 4.99%)
Oil: WTI Crude oil experienced a minor tactical pullback following strong weekend gains, though underlying physical market tightness limited downside. (Crude Oil Close: $102.15)
Gold: Spot gold traded with modest upside, benefiting from safe-haven hedging ahead of heavy macro data prints. (Gold Close: $4,128.50)
Digital assets: Digital assets saw mild downside consolidation, tracking broader high-beta risk sentiment. (Bitcoin Close: $80,150.00)
Market Summary for Tuesday, Oct 27th
Equities: Stocks extended their upward trajectory into a second session, anchored by strong gains in mega-cap technology ahead of key post-market earnings reports. (S&P 500 Close: 7,722.60)
Bonds: Fixed-income markets faced modest selling pressure as yields pushed back toward cycle resistance levels. (10-Year Treasury Yield Close: 5.01%)
Oil: Energy prices resumed their upward advance on renewed geopolitical supply concerns across key transit chokepoints. (Crude Oil Close: $103.10)
Gold: Gold prices drifted slightly lower as real bond yields moved upward, dampening demand for non-interest-bearing assets. (Gold Close: $4,095.20)
Digital assets: Bitcoin and major altcoins traded in a narrow range as traders awaited earnings catalysts from tech bellwethers. (Bitcoin Close: $80,890.00)
Market Summary for Wednesday, Oct 28th
Equities: Equities posted minor gains in a choppy session, digesting the Federal Reserve's rate decision alongside mixed earnings results from major software and enterprise cloud providers. (S&P 500 Close: 7,743.98)
Bonds: Benchmark yields surged to touch midweek highs before retreating slightly following Chair Powell's press conference commentary. (10-Year Treasury Yield Close: 5.03%)
Oil: Crude futures surged higher, breaching multi-week resistance following tighter-than-expected inventory drawdowns. (Crude Oil Close: $104.85)
Gold: Gold slid under selling pressure as a firm U.S. dollar and elevated long-term borrowing costs constrained precious metals. (Gold Close: $4,042.00)
Digital assets: Crypto markets pulled back moderately as broader liquidity expectations remained tight post-FOMC. (Bitcoin Close: $79,410.00)
Market Summary for Thursday, Oct 29th
Equities: Equity markets gave back midweek gains as institutional rotation favored defensive sectors over growth ahead of Friday's massive earnings slate. (S&P 500 Close: 7,718.50)
Bonds: Treasury bonds rallied into the close, pulling the 10-year yield back below 5.00% as safe-haven bids began to emerge. (10-Year Treasury Yield Close: 4.97%)
Oil: Energy markets sustained elevated pricing, hovering near weekly highs amid persistent middle-distillate supply tightness. (Crude Oil Close: $105.20)
Gold: Spot gold stabilized near key moving average support following three consecutive sessions of selling pressure. (Gold Close: $4,015.80)
Digital assets: High-beta digital assets continued to consolidate sideways near technical support bands. (Bitcoin Close: $78,650.00)
Market Summary for Friday, Oct 30th
Equities: U.S. equities suffered a sharp tech-led sell-off to close the week as disappointing semiconductor earnings and cautious corporate forward guidance triggered a broad de-risking event. (S&P 500 Close: 7,580.07)
Bonds: Fixed-income assets rallied strongly into the weekend, driving yields down as safe-haven duration buying accelerated during the stock sell-off. (10-Year Treasury Yield Close: 4.93%)
Oil: WTI Crude closed out its third consecutive positive week, maintaining strong gains near multi-month highs. (Crude Oil Close: $103.43)
Gold: Gold experienced heavy Friday liquidation, falling alongside broader asset classes during intense risk-off rebalancing. (Gold Close: $3,995.40)
Digital assets: Bitcoin fell sharply in lockstep with mega-cap growth stocks, breaking below key psychological support into Friday's close. (Bitcoin Close: $77,148.53)
Notable Earnings Due for week of Nov 2nd–6th
Corporate earnings season hits its peak velocity during the week of November 2nd–6th, anchored by heavyweights across technology, pharmaceuticals, payment processing, industrial manufacturing, and global broad-line retail. Market participants will be paying close attention to enterprise software demand, consumer transaction trends, healthcare margin resilience, and ongoing semiconductor capital expenditures against the backdrop of elevated long-term interest rates.
The actual earnings date may vary, so traders should confirm with their brokers. If a trader wishes to open a position to participate in earnings announcements, it is important to check whether the earnings are released BEFORE the markets open or AFTER the markets close on the date of earnings.
Mon, Nov 2nd: AAPL / CLX / EL / MAR / O / ON / PLTR / VRTX / WMB
Tue, Nov 3rd: AMD / AMGN / ANET / APO / BKNG / ETN / MPC / PFE / RACE / SHOP / XYZ
Wedn, Nov 4th: ALL / APP / ARM / CVS / EMR / KHC / MCD / MET / MSI / NVO / QCOM / UBER / YUM
Thu, Nov 5th: ABNB / CAH / CELH / CI / CORZ / TEAM / U
Fri, Nov 6th: BAM / CHTR / HUM / MRNA / VST
Economic Calendar Due for week of Nov 2nd–6th
The macroeconomic schedule for the week of November 2nd–6th shifts focus firmly toward labor market conditions and services-sector health, culminating in Friday's crucial October Nonfarm Payrolls report. Coming immediately on the heels of the Federal Reserve's policy stance and ongoing Big Tech earnings volatility, these data prints will clarify whether economic growth is maintaining resilience or cooling under elevated borrowing costs. With market participants hyper-sensitive to any signs of labor market softening, this week's employment updates will play a central role in refining expectations for the central bank's December rate trajectory.
Monday, November 2nd
- S&P Global U.S. Manufacturing PMI (Final), ISM Manufacturing PMI, & Construction Spending
Schaeffer's Investment Research
These manufacturing survey metrics gauge broad industrial sector health, new order volumes, and input price dynamics across the U.S. industrial base. Soft manufacturing activity or contracting order books could fuel concerns over broader economic deceleration, while elevated prices paid sub-indexes could reinforce sticky inflation risks.
Tuesday, November 3rd:
- JOLTS Job Openings & Factory Orders
Schaeffer's Investment Research
The Job Openings and Labor Turnover Survey provides critical insights into underlying labor demand and job market tightness by measuring total open positions relative to available workers. A sharp contraction in job openings would signal labor market normalization, whereas persistent high vacancy rates could keep pressure on wage growth expectations.
Wednesday, November 4tht
- ADP Employment Report, ISM Services PMI, & U.S. Trade Balance
Schaeffer's Investment Research
The ADP report offers an early private-sector hiring proxy ahead of official government data, while the ISM Services PMI measures conditions in the vast U.S. services economy. Strong readings in services activity and service-sector pricing could spark concerns of persistent inflation, while weaker prints might trigger risk-off economic growth anxieties.
Thursday, November 5th
- Weekly Initial Jobless Claims, Preliminary Q3 Productivity & Unit Labor Costs
Schaeffer's Investment Research
Weekly unemployment claims offer real-time tracking of labor market layoffs, while productivity and labor cost metrics evaluate how efficiently output is expanding relative to compensation growth. Rising jobless claims alongside accelerating labor costs could squeeze corporate profit margins, directly impacting equity valuations.
Friday, November 6th
- U.S. Nonfarm Payrolls Report (Unemployment Rate & Average Hourly Earnings) & University of Michigan Consumer Sentiment (Preliminary)
Schaeffer's Investment Research
The monthly jobs report stands as the week's headline event, revealing net job creation, the official unemployment rate, and wage inflation trends across the national economy. Strong payroll additions or upside wage gains could prompt rate-cut expectations to recede, while a softer employment print could spark yield pullbacks and safe-haven duration buying across bond markets.
Blue Sky Horizons
Evaluating the Rumored SpaceX and Tesla Merger
A potential corporate restructuring is the talk off the town: the formal evaluation of a merger between Space Exploration Technologies (SpaceX) and Tesla (TSLA). This restructuring certainly has the market's attention. Following the formation of special committees by independent directors at both companies to examine a business combination, Wall Street has begun pricing in the strategic implications of creating a combined industrial and technology entity with an estimated valuation ranging from $3.5 trillion to $5 trillion.
While discussions remain exploratory and subject to shareholder and committee approvals, analyzing the potential strategic synergies alongside the operational trade-offs offers a helpful framework for systematic investors.
Strategic Pros
- Semiconductor & AI Vertical Integration: Combining SpaceX's Starlink constellation and xAI compute stack with Tesla's full self-driving (FSD) and Optimus robotics efforts could create a vertically integrated hardware-and-software ecosystem. Shared initiatives, such as the proposed "Terrafab" semiconductor manufacturing facility, could streamline supply chains and reduce reliance on third-party foundries.
- Balance Sheet Efficiency: Tesla's balance sheet cash reserves (approximately $45 billion) could provide capital to fund SpaceX's capital-intensive orbital infrastructure, Starship developments, and AI data center expansion without relying heavily on debt markets or dilutive private funding rounds.
- Satellite Connectivity Integration: Direct integration of Starlink satellite nodes into Tesla's global fleet could enhance autonomous vehicle fleet connectivity, low-latency telematics, and edge computing capabilities across areas with limited terrestrial cellular coverage.
Strategic Cons
- Dilution & Governance Friction: For Tesla shareholders, acquiring or merging with an aerospace entity introduces execution risks unique to space launch operations, highly intensive capital expenditure cycles, and regulatory oversight.
- Valuation Disparities: Merging a high-growth, privately held aerospace utility with a mature automotive and energy storage company could complicate financial metrics. Investors seeking pure-play exposure to electric vehicles or energy storage might discount the combined equity due to aerospace capital demands.
- Regulatory & Antitrust Scrutiny: Given the sheer scale of the proposed entity, regulatory agencies in the U.S. and Europe would likely initiate protracted antitrust and foreign ownership reviews, potentially creating an extended period of headline uncertainty for TSLA options pricing.
For options traders monitoring macro tech trends, the NeoCloud sector highlights a growing divergence between physical AI infrastructure costs and market valuations. While high-beta tech equities may face pressure from rising debt servicing costs and massive capex cycles, volatility in the space could present selective opportunities in defined-risk options strategies—such as call diagonals or iron condors—around major earnings announcements and capital expenditure updates from cloud hyperscalers and chipmakers alike.
TAKEAWAYS
If a combination of SpaceX and Tesla were to materialize, self-directed investors might consider monitoring several adjacent companies and sector proxies for their focus lists:
- Rocket Lab USA (RKLB): As a primary publicly traded alternative in commercial launch services and satellite component manufacturing, Rocket Lab could capture focused institutional interest from investors seeking a pure-play space exploration allocation outside of a complex conglomerate.
- AST SpaceMobile (ASTS): Given the emphasis on space-based broadband and direct-to-cell connectivity via Starlink, satellite telecommunications providers could see increased strategic valuation attention and potential partnership interest from legacy telecom carriers.
- Taiwan Semiconductor Manufacturing Co. (TSMC / TSM): Any shifts in custom semiconductor design or domestic chip manufacturing (such as the Terrafab initiative) highlight the strategic importance of semiconductor foundries and equipment manufacturers. Pure-play foundry market leaders remain essential benchmarks for hardware infrastructure expansion.
- Kratos Defense & Security Solutions (KTOS): Companies specializing in satellite communications, ground systems, and defense electronics could see expanded sub-contracting demand or strategic partnerships as aerospace and terrestrial communications infrastructure converge.
Thank you for reading. Until next week's close,
Have a safe and productive Trading week!
Fauzia Timberlake
About the Author: Fauzia Timberlake is a professional options coach and financial strategist specializing in risk management and portfolio architecture for self-directed investors. She is Founder and Managing Partner of Option Engines.
Questions / Comments
We're here to serve IVolatility users and we welcome your questions or feedback about the option strategies discussed in this newsletter. If there is something you would like us to consider and/or analyze, we're always open to your suggestions. Use support@ivolatility.com.
Previous issues are located under the Trade Ideas tab on our website.