Does High VIX Predict SPY Declines? Part II: Testing IV Percentile as a Trading Signal
From Percentile to Premium: Can IVP Time Options and Equity Entries on SPY?
Summary
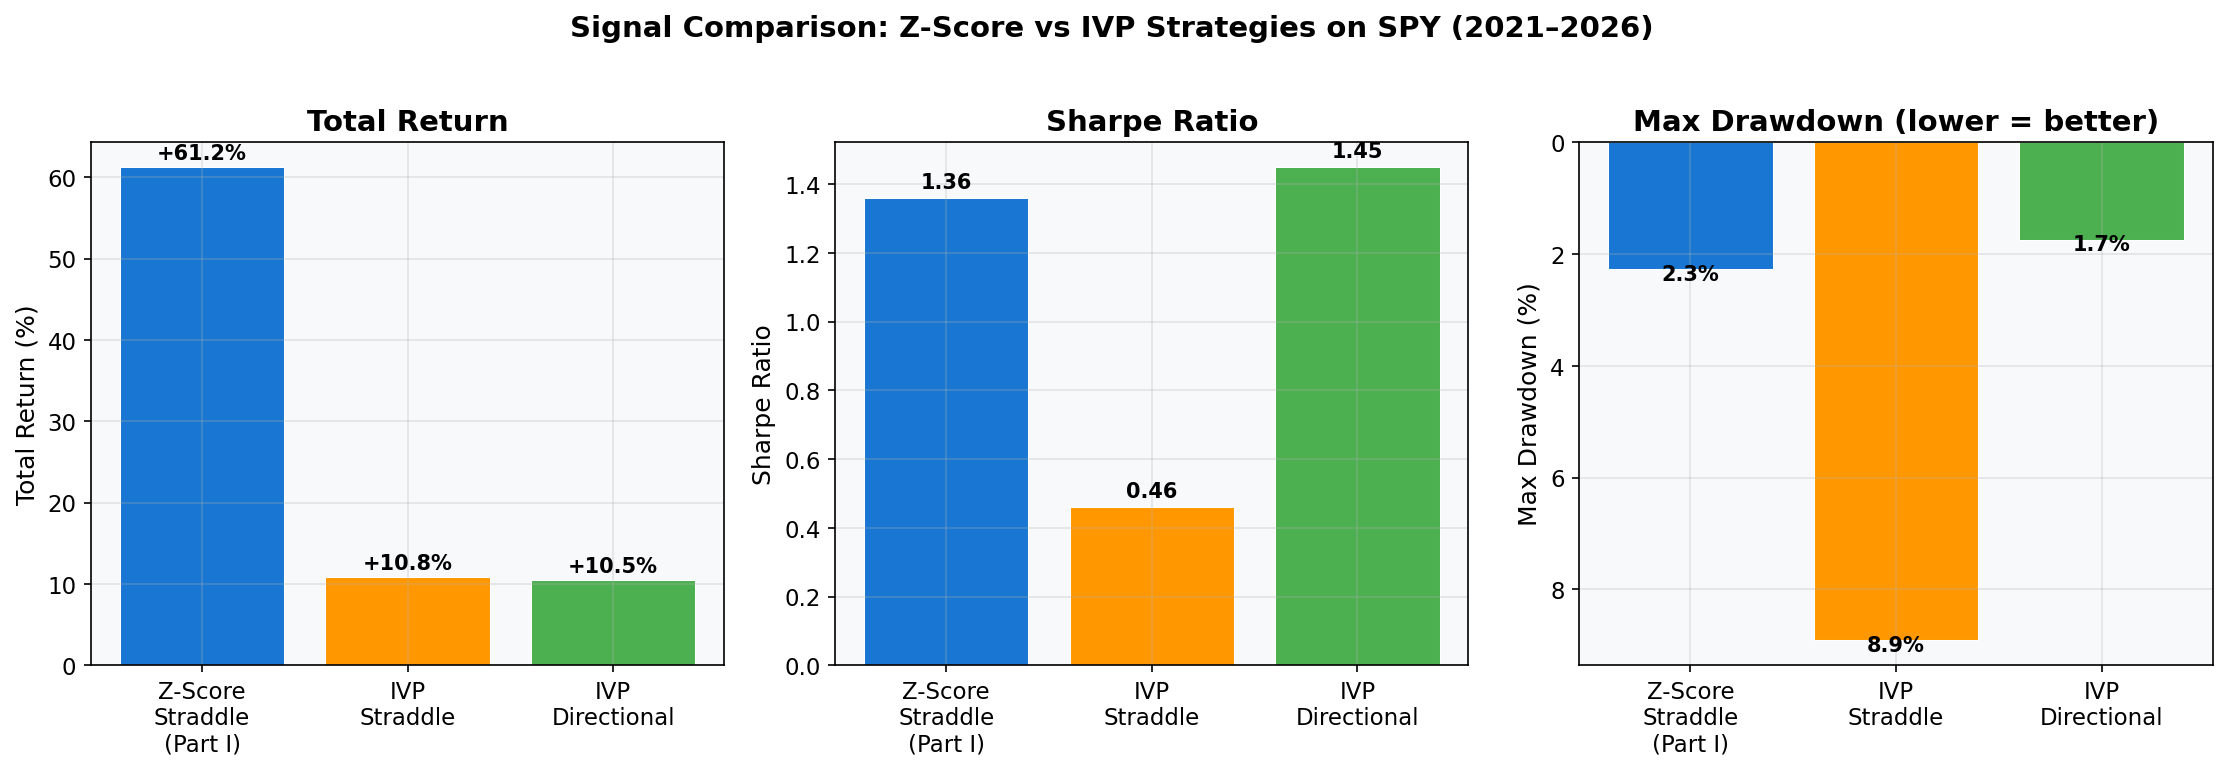
In Part I: of this Study, we established that the IVX30 z-score — measuring how fast IV has spiked relative to its own recent history — is the strongest signal for timing short straddle entries on SPY. The z-score strategy returned +61.24% on 10% allocated capital over 5 years (Sharpe 1.36, MaxDD 2.27%).
This naturally raises a follow-up question: what about IV Percentile (IVP) — the percentage of days in a rolling window where IV was lower than today? IVP measures where IV stands in its historical distribution, rather than how fast it moved. If IVP > 50, IV is above its historical median — a simpler and more intuitive condition than z-score > 1.5.
We tested IVP as both an entry and exit signal for two strategies on SPY over the same 5-year period (Feb 2021 – Feb 2026): (1) selling ATM straddles (volatility premium capture) and (2) buying SPY shares (directional equity exposure). The results reveal a clear hierarchy between "spike detection" and "level detection" as trading signals, and show that IVP works better as a directional timing tool than as a straddle entry signal.
Key Findings
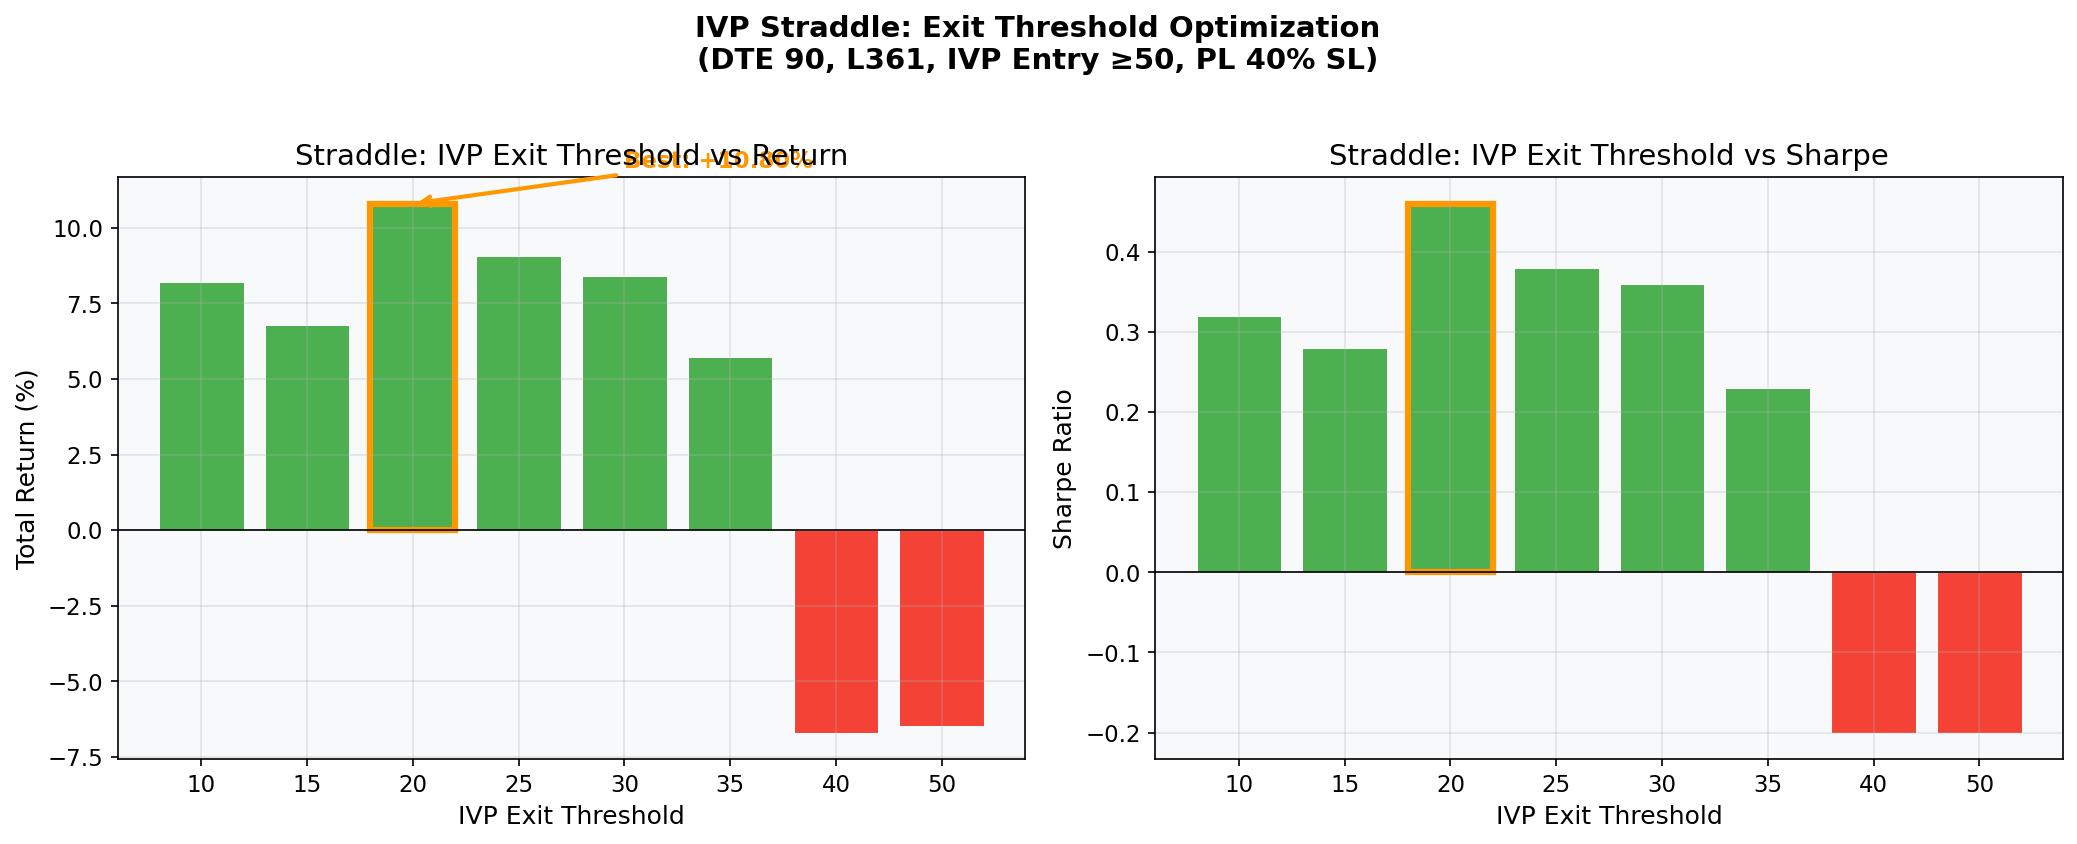
- IVP is a valid but inferior straddle signal. Best straddle configuration (IVP entry ≥ 50, exit < 20, 90-DTE, PL 40% SL) returned +10.80% (Sharpe 0.46, MaxDD 8.91%) — profitable, but far behind z-score's +61.24%.
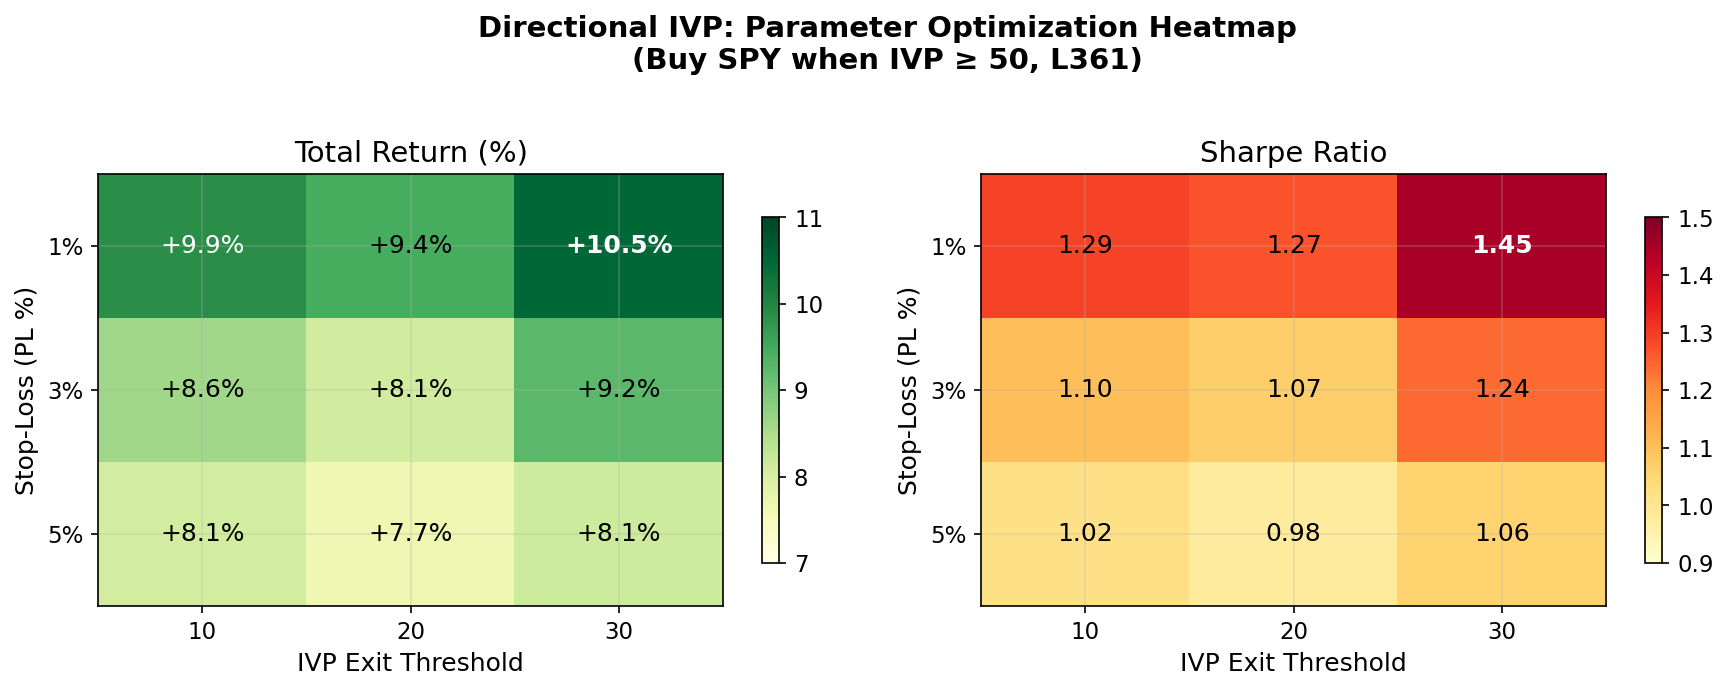
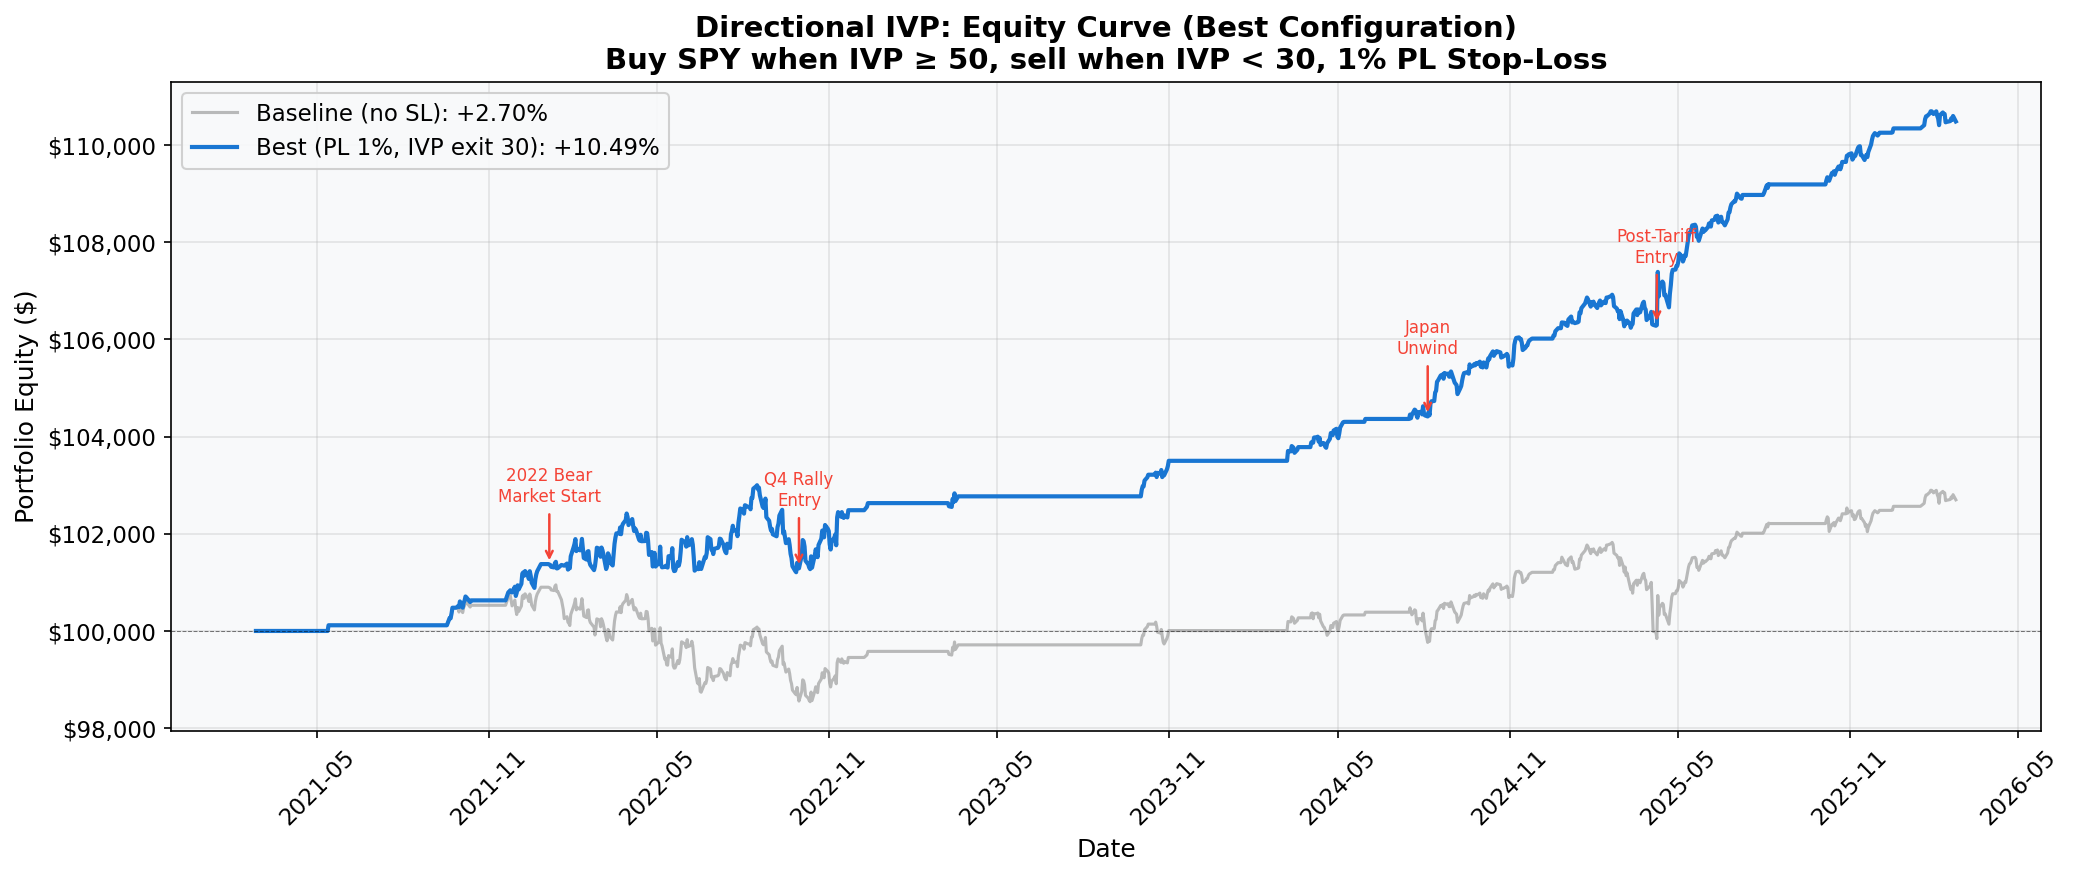
- IVP works better for directional equity entries. Best directional configuration (buy SPY when IVP ≥ 50, sell when IVP < 30, PL 1% SL) returned +10.49% (Sharpe 1.45, MaxDD 1.74%) — higher Sharpe and lower drawdown than the straddle approach.
- IVP exit threshold = 20 is optimal for straddles, 30 for directional. Sweeping from 10 to 50, the straddle strategy prefers waiting until IV drops to the bottom quintile; directional prefers a quicker exit when IV normalizes.
- IVP requires stop-loss; z-score does not. Without SL, IVP straddle returns +0.50%. With PL 40% SL, it returns +10.80%. The opposite held for z-score (SL degraded z-score performance).
- The core difference is entry timing. Z-score enters on sudden spikes (15.5d avg hold); IVP enters on sustained elevated IV (41d avg hold). Shorter entries = less exposure to adverse moves.
- IVP's best use may be as a z-score confirmation filter, reducing false entries during low-volatility regimes.
1. Signal Design and Methodology
Section 10 demonstrated that the IVX30 z-score — measuring how fast IV has spiked — is a powerful entry signal for selling straddles. But there is an alternative: IV Percentile (IVP), which measures how high IV is relative to its own history, regardless of how quickly it arrived there.
We tested whether IVP works as both an entry and exit signal: enter when IV is elevated (IVP ≥ threshold), exit when IV has mean-reverted (IVP < exit threshold). This is conceptually different from the z-score approach, which enters on a rate of change event and exits when the rate normalizes.
Signal Definition
- IV Percentile (IVP): Percentage of trading days in a rolling lookback window where IVX30 Mean IV was lower than today's value. IVP = 80 means IV is higher than 80% of the past year's readings.
- Entry signal: IVP ≥
ivp_entry_threshold(e.g., 50 = IV above historical median) - Exit signal: IVP <
ivp_exit_threshold(e.g., 20 = IV has dropped to bottom quintile of history) - IVX tenor: 30-day IVX Mean IV (
iv_30d_mean), independent of option expiry - Position: Sell ATM straddle, same mechanics as Section 10
Key Design Choice: IVX Tenor Independence
A critical implementation detail: the IVX tenor used for IVP computation must be independent of the option's DTE target. We initially coupled them (using iv_120d_mean for 120-DTE options), which produced a different — and incorrect — signal. The fix: always compute IVP from iv_30d_mean regardless of which expiration is traded. The 30-day IVX captures the market's near-term fear level most accurately.
IVP Exit Threshold Optimization
We swept the IVP exit threshold from 10 to 50 with all other parameters fixed at their optimals (DT90, L361, IVP entry ≥50, PL 40% stop-loss):
| IVP Exit | Return | Sharpe | Max DD | Trades | IVP Exits | SL | PT |
|---|---|---|---|---|---|---|---|
| 10 | +8.20% | 0.32 | 10.3% | 22 | 10 | 4 | 4 |
| 15 | +6.78% | 0.28 | 9.9% | 23 | 13 | 3 | 3 |
| 20 | +10.80% | 0.46 | 8.9% | 24 | 15 | 3 | 2 |
| 25 | +9.08% | 0.38 | 9.0% | 25 | 16 | 3 | 2 |
| 30 | +8.40% | 0.36 | 8.8% | 28 | 19 | 3 | 2 |
| 35 | +5.72% | 0.23 | 11.7% | 34 | 26 | 3 | 2 |
| 40 | -6.70% | -0.20 | 12.2% | 38 | 31 | 4 | 2 |
| 50 | -6.47% | -0.20 | 12.6% | 46 | 40 | 3 | 2 |
The optimal IVP exit threshold is 20 — wait until IV drops to the bottom quintile of its history before closing. Above 30, the exit triggers too early (cuts winners short); above 40, the strategy turns negative as it exits before theta/vega can generate meaningful returns.
Best Configuration Results
Best configuration: DTE 90, lookback 361 days (252 trading days), IVP entry ≥ 50, IVP exit < 20, PL 40% stop-loss
| Metric | IVP Baseline (no SL) | IVP Best (PL 40%) |
|---|---|---|
| Total Return | +0.50% | +10.80% |
| CAGR | 0.10% | 2.07% |
| Sharpe | 0.05 | 0.46 |
| Max Drawdown | -11.67% | -8.91% |
| Win Rate | 57.7% | 62.5% |
| Profit Factor | 1.02 | 1.72 |
| Total Trades | 26 | 24 |
| Avg Holding | 34 days | 41 days |
| Exposure Time | 49.9% | 55.2% |
Unlike the z-score straddle, the IVP strategy benefits significantly from stop-loss. Without SL, the strategy barely breaks even (+0.50%). With PL 40% SL, returns jump to +10.80% and Sharpe improves 9x (0.05 → 0.46). This is because IVP can remain elevated for extended periods during sustained market stress (e.g., 2022 bear market, 2025 tariff crisis), keeping positions open through large adverse moves that a stop-loss would have cut.
IVP Annual Returns
| Year | SPY | IVP Baseline (no SL) | IVP Best (PL 40%) |
|---|---|---|---|
| 2021 | +21.23% | +4.10% | +6.13% |
| 2022 | -19.48% | -5.49% | +4.63% |
| 2023 | +24.29% | +0.58% | +1.06% |
| 2024 | +23.30% | +4.08% | +5.04% |
| 2025 | +16.35% | -3.75% | -7.05% |
| 2026 (partial) | +0.07% | +0.99% | +0.99% |
The IVP strategy was profitable in 4 of 5 full years. The 2025 loss (-7.05%) was driven by the April tariff-crisis trade: IV remained elevated for 71 days (IVP 91 → 29), and the straddle absorbed a large SPY move before IV finally normalized. The stop-loss limited the damage but couldn't prevent the loss entirely.
Comparison: Z-Score vs IVP as Straddle Signals
| Metric | Z-Score (Section 10) | IVP (this section) |
|---|---|---|
| Signal Type | Rate of change (spike) | Level (percentile) |
| Entry | IVX30 z > 1.5 | IVP30 ≥ 50 |
| Exit | z < 0.3 | IVP < 20 |
| Total Return | +61.24% | +10.80% |
| Sharpe | 1.36 | 0.46 |
| Max Drawdown | -2.27% | -8.91% |
| Trades | 26 | 24 |
| Avg Hold | 15.5 days | 41 days |
| Stop-Loss | Hurts performance | Helps (essential) |
| Exposure | 23.5% | 55.2% |
The z-score signal outperforms IVP by a wide margin. The key differences:
Entry timing. Z-score captures sudden IV spikes — the precise moments when option premium is most inflated. IVP captures sustained elevated IV, which often means IV has already begun normalizing or the market is in a prolonged stress regime. Z-score entries are faster (15.5d avg hold vs 41d), meaning less exposure to adverse price moves.
Exit mechanism. Z-score exit (z < 0.3) triggers quickly as IV normalizes relative to its recent history. IVP exit (IVP < 20) requires IV to drop to the bottom quintile of a much longer (1-year) window — this is slower and keeps positions open through potentially large moves.
Stop-loss interaction. The z-score strategy is harmed by stop-loss because its short, precise entries rarely experience large adverse moves. The IVP strategy requires stop-loss because its longer holding periods expose it to sustained trends.
Implications
IVP is a valid but inferior entry signal compared to z-score for short straddle strategies on SPY. Its primary weakness is timing: entering when IV is "high" is less precise than entering when IV has "just spiked." However, IVP provides a useful confirmation layer — the Section 10 analysis showed that adding an IVP ≥ 50 filter to the z-score signal could reduce false entries during low-volatility regimes.
For practitioners who cannot implement z-score computation, IVP offers a simpler alternative with the key caveat that stop-loss management becomes essential, and expected returns are significantly lower.
2. IVP as a Directional Equity Signal: Buying SPY During High IV
The straddle strategy tests whether IVP can time volatility premium extraction. But a simpler question follows: can IVP time equity entries? The logic is straightforward — elevated IV often coincides with market pullbacks. If IV is high (IVP ≥ 50) and subsequently normalizes (IVP < exit threshold), the equity market has likely recovered. Buying SPY shares when IV is elevated and selling when it normalizes should capture the rebound.
Strategy Design
- Entry: Buy SPY shares when IVP ≥ 50 (same as straddle)
- Exit: Sell when IVP drops below
ivp_exit_threshold(IV mean-reverted = market recovered) - Stop-loss: P&L-based (percentage of position value), intraday monitoring (MINUTE_1)
- Position size: 10% of capital per trade
- No profit target (let the IVP exit signal handle timing)
Directional IVP Results
All 9 combinations use IVP entry ≥ 50, lookback 361 days:
| PL SL | IVP Exit | Return | Sharpe | Max DD | Trades | Win Rate | PF |
|---|---|---|---|---|---|---|---|
| 1% | 10 | +9.87% | 1.29 | 1.75% | 44 | 29.5% | 51.0 |
| 1% | 20 | +9.45% | 1.27 | 1.75% | 47 | 31.9% | 47.9 |
| 1% | 30 | +10.49% | 1.45 | 1.74% | 59 | 33.9% | 43.2 |
| 3% | 10 | +8.61% | 1.10 | 1.67% | 26 | 50.0% | 40.7 |
| 3% | 20 | +8.09% | 1.07 | 1.67% | 29 | 51.7% | 36.1 |
| 3% | 30 | +9.25% | 1.24 | 1.66% | 36 | 55.6% | 35.9 |
| 5% | 10 | +8.07% | 1.02 | 1.93% | 20 | 65.0% | 41.3 |
| 5% | 20 | +7.65% | 0.98 | 1.93% | 23 | 65.2% | 35.7 |
| 5% | 30 | +8.13% | 1.06 | 1.93% | 28 | 71.4% | 35.5 |
Baseline (no SL): +2.70%, Sharpe 0.41, MaxDD 2.38%, 20 trades.
Key Observations
Tight stop-loss dominates. The 1% PL SL configurations outperform 3% and 5% across all IVP exit thresholds. With a tight SL, the strategy takes many small losses (win rate 30-34%) but captures large rebounds when IV normalizes — a classic trend-following profile with high profit factor.
IVP exit = 30 is optimal for directional. Unlike straddles (optimal at 20), the directional strategy benefits from exiting earlier — once IV drops to the bottom 30%, the equity rebound is largely complete. Waiting for IVP < 10 or 20 adds holding time without proportional gains.
Exceptional risk-adjusted returns. The best combo (PL 1%, IVP exit 30) achieves Sharpe 1.45 with only 1.74% max drawdown. This compares favorably to both the IVP straddle (Sharpe 0.46, MaxDD 8.91%) and the z-score straddle (Sharpe 1.36, MaxDD 2.27%).
Win rate vs profit factor trade-off. Tighter SL produces lower win rate but much higher profit factor (43.2 at PL 1% vs 35.5 at PL 5%). The strategy wins big on a few trades and loses small on many — the opposite pattern from the straddle strategy.
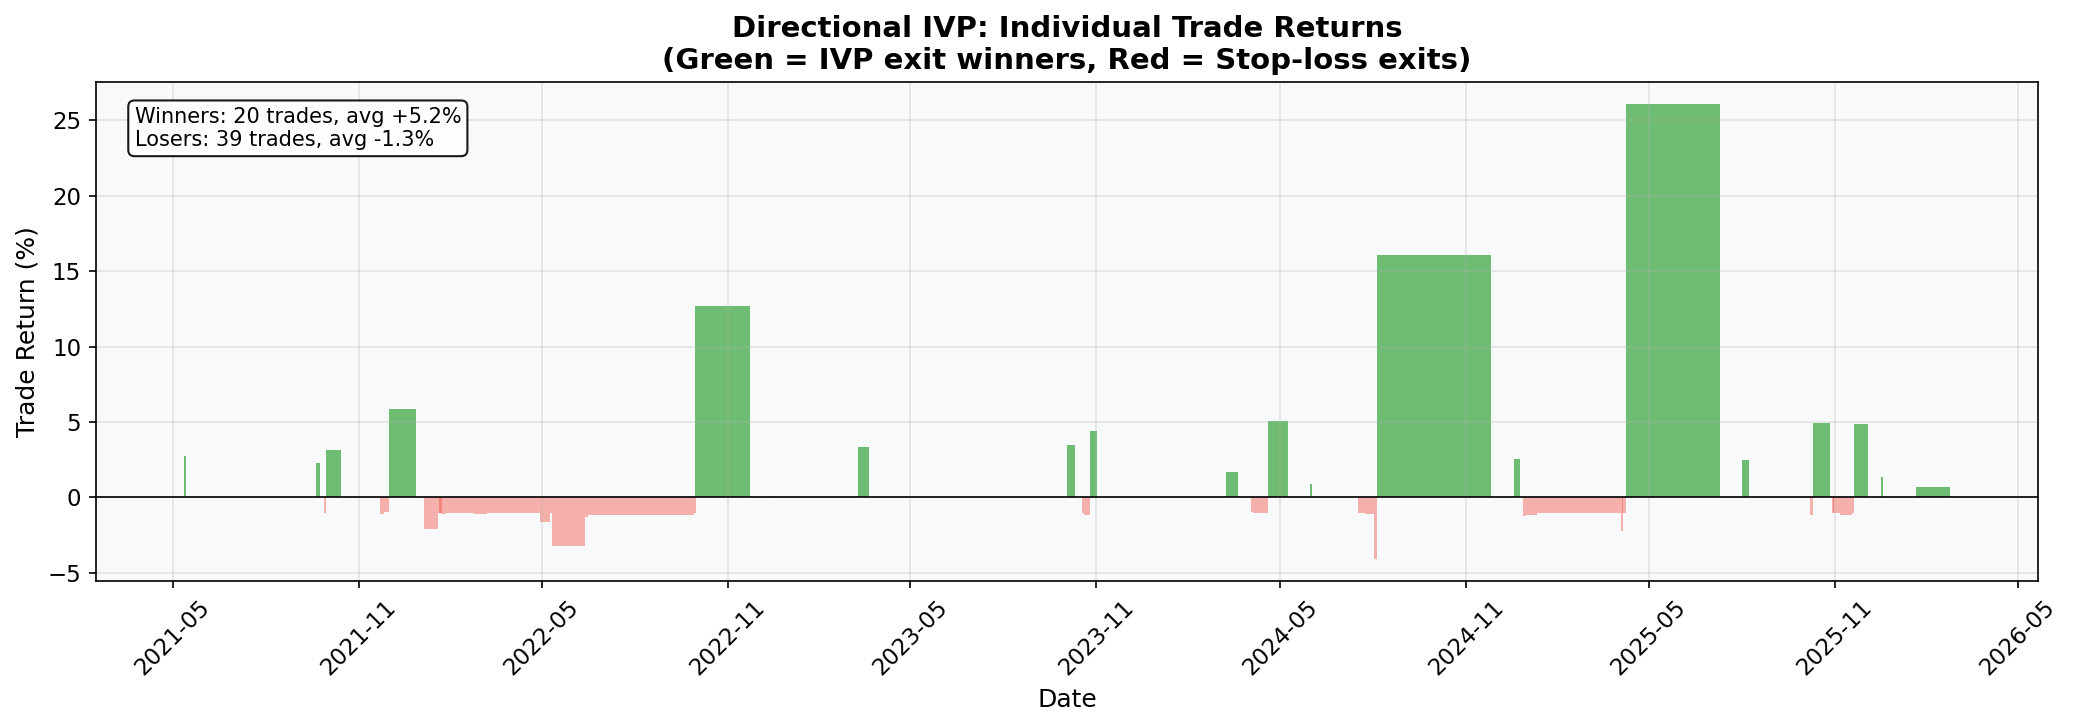
Trade-Level Analysis (Best Configuration: PL 1%, IVP Exit 30)
The best directional configuration produced 59 trades over 5 years: 20 winners (34%) and 39 losers (66%). Despite losing twice as often as winning, the strategy returned +10.49% because the average winner (+$561, +5.48%) dwarfed the average loser (-$6.37, -1.28%).
P&L breakdown by exit type:
| Exit Type | Trades | Total P&L | Avg P&L | Avg Return | Avg Hold |
|---|---|---|---|---|---|
| IVP exit (signal) | 19 | +$10,660 | +$561 | +5.48% | 21.8 days |
| Stop-loss (1% PL) | 39 | -$248 | -$6.37 | -1.28% | 11.5 days |
| End of backtest | 1 | +$77 | +$77 | +0.71% | 34 days |
The strategy's edge is clear: 19 IVP exits generated +$10,660 in profits, while 39 stop-loss exits cost only -$248 in total. Each winning trade earned 88x the average losing trade. The tight 1% stop-loss limits each loss to roughly $5-7 (on a ~$10,000 position), while winning trades — held until IV normalizes — capture multi-percent rebounds.
Top 5 winning trades:
| Entry | Exit | Hold | Return | IVP at Entry | Market Context |
|---|---|---|---|---|---|
| 2025-04-08 | 2025-07-10 | 93d | +26.05% | 100 | Post-tariff rebound: entered after 6 consecutive SL exits during April tariff crisis; IVP at maximum |
| 2024-08-05 | 2024-11-26 | 113d | +16.09% | 100 | Japan carry-trade unwind recovery: entered at absolute panic (IVP 100) after -4% gap |
| 2022-09-30 | 2022-11-23 | 54d | +12.67% | 94 | Bear market rally: entered after 15 consecutive SL exits through Jan-Sep 2022 drawdown |
| 2021-12-01 | 2021-12-28 | 27d | +5.85% | 99 | Omicron scare recovery: re-entered after 2 SL exits, caught December rebound |
| 2025-10-10 | 2025-10-27 | 17d | +4.93% | 82 | Re-entered after 1 SL exit, quick IV normalization |
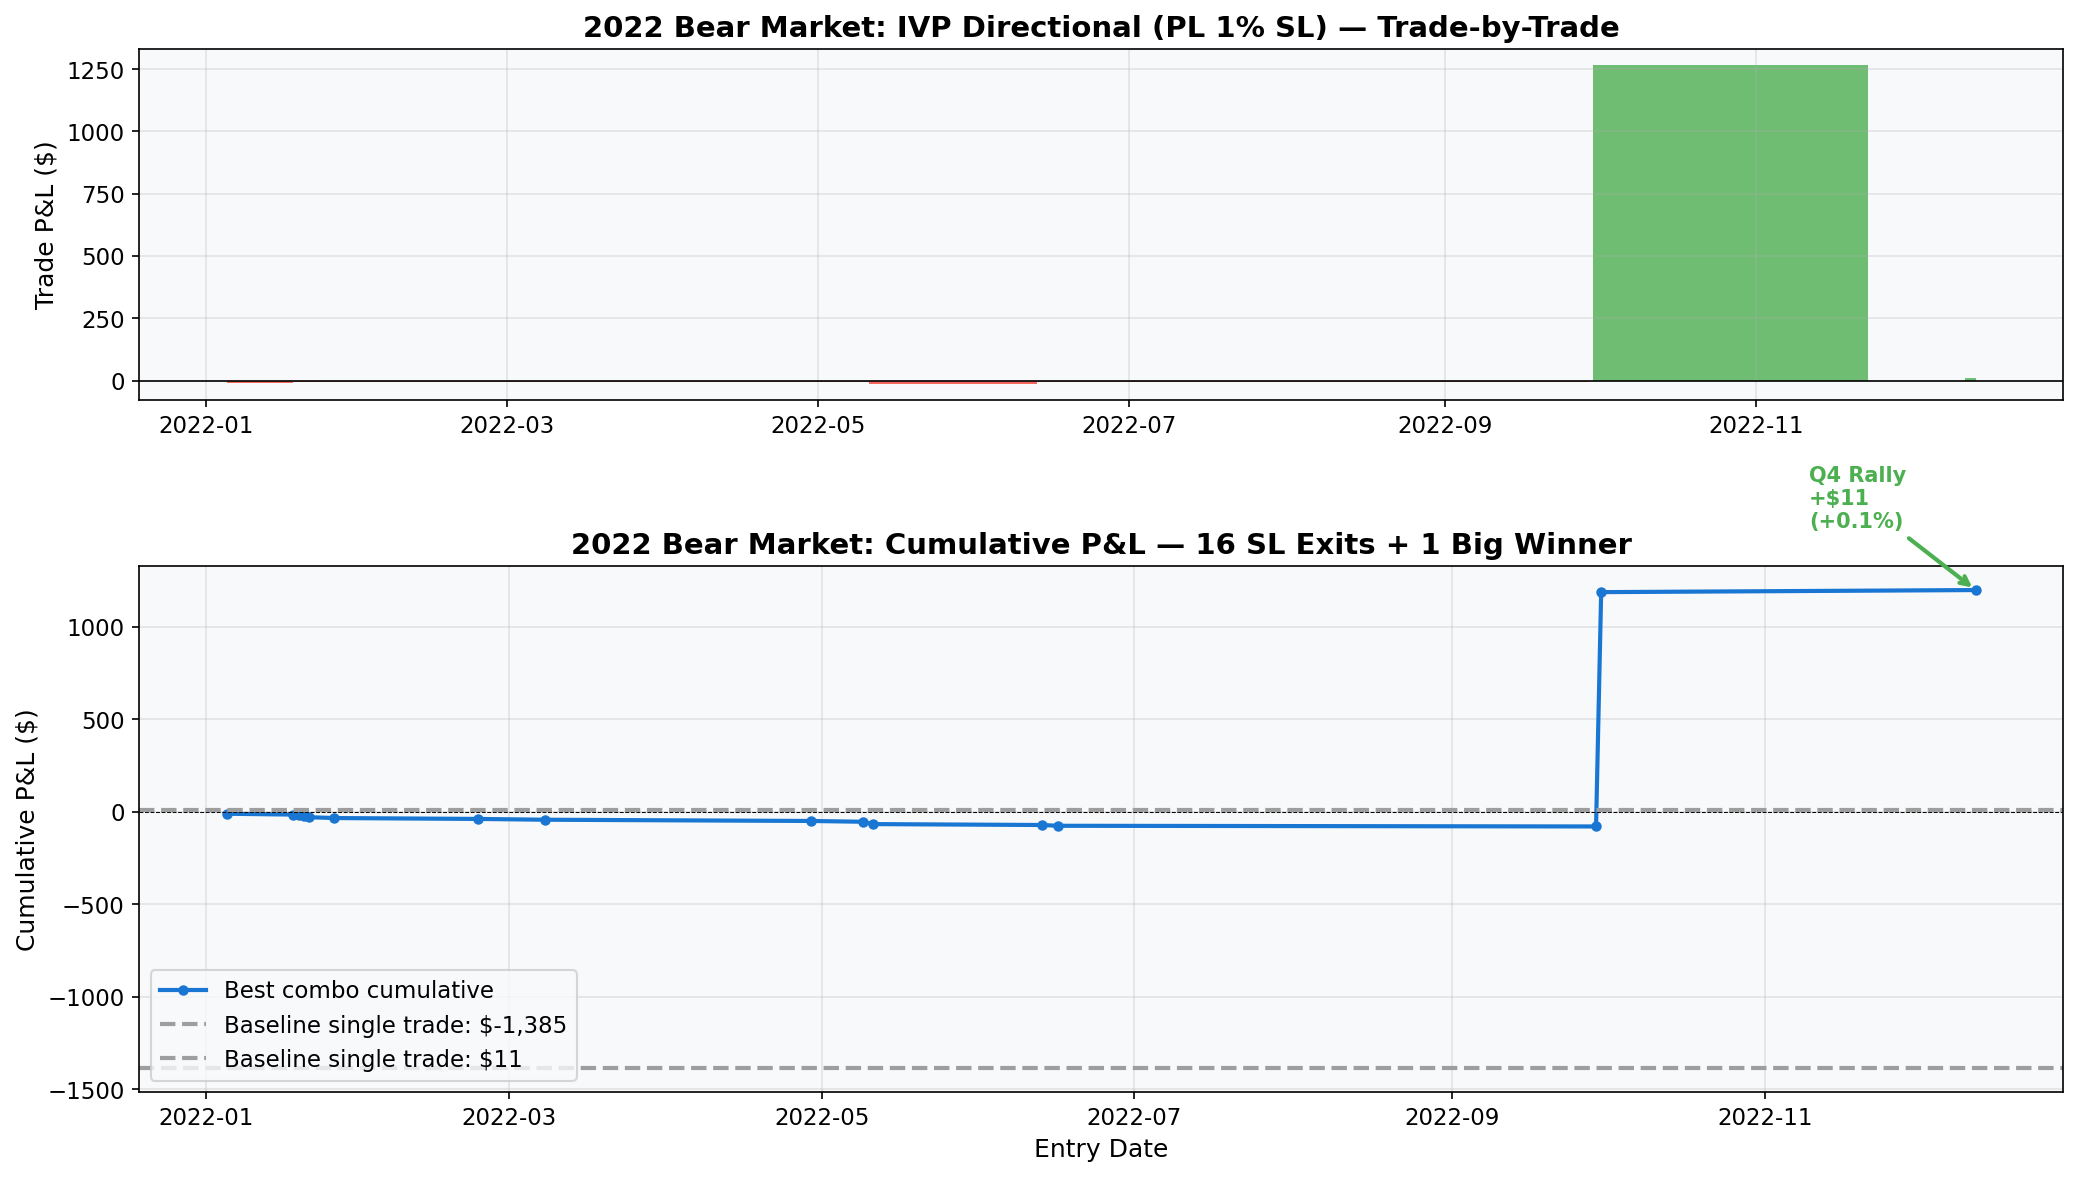
The 2022 bear market case study. This period illustrates the strategy's core mechanism. The baseline (no SL) entered on 2022-01-05 and held for 322 days through the entire bear market, exiting on 2022-11-23 with -$1,385 (-14.08%). The best combo entered on the same day — but the 1% SL triggered on 2022-01-18 (-2.07% gap-through, Ukraine escalation). It then re-entered and stopped out 14 more times through September, losing a cumulative -$105 across 16 SL exits. On 2022-09-30, it re-entered at IVP 94 and caught the Q4 rally, exiting on 2022-11-23 with +$1,267 (+12.67%). Net result for the 2022 bear: +$1,162 vs baseline's -$1,385 — a $2,547 advantage from the same entry signal.
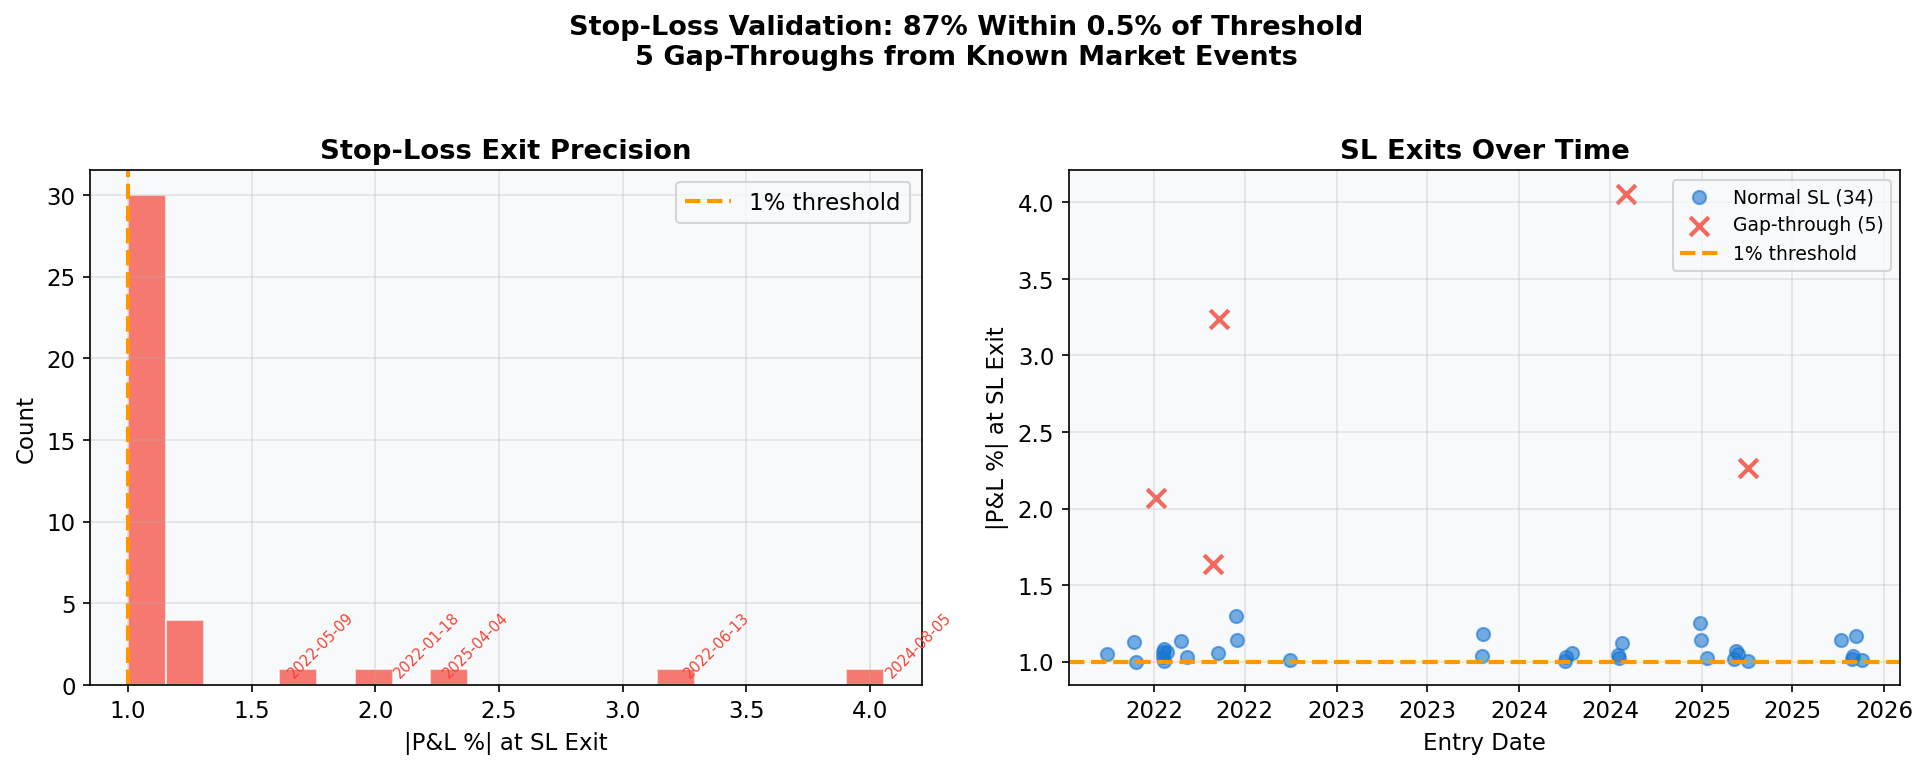
Stop-loss precision. Of the 39 SL exits, 34 (87%) triggered within 0.5% of the 1% threshold. The 5 outliers — ranging from -1.64% to -4.06% — correspond to known overnight gap events: the Japan carry-trade unwind (Aug 5, 2024: -4.06%), the CPI shock (Jun 13, 2022: -3.24%), tariff retaliation (Apr 4, 2025: -2.26%), and two other gap-downs in the 2022 bear market. These gap-throughs are unavoidable in equity strategies — the SL can only trigger at the next available intraday price after an overnight gap.
Straddle vs Directional: IVP Signal Comparison
| Metric | IVP Straddle | IVP Directional |
|---|---|---|
| Best Return | +10.80% | +10.49% |
| Best Sharpe | 0.46 | 1.45 |
| Max Drawdown | -8.91% | -1.74% |
| Optimal IVP Exit | 20 | 30 |
| Optimal SL | PL 40% | PL 1% |
| Trades | 24 | 59 |
| Win Rate | 62.5% | 33.9% |
| Profit Factor | 1.72 | 43.2 |
| Risk Profile | Moderate DD, moderate trades | Very low DD, many trades |
The directional strategy produces similar total returns but with dramatically better risk-adjusted performance (Sharpe 1.45 vs 0.46) and much lower drawdown (1.74% vs 8.91%). This makes sense: buying SPY during high-IV pullbacks is fundamentally a mean-reversion equity trade, and the tight 1% SL limits exposure to the rare occasions when the pullback extends into a sustained bear market.
3. Conclusions and Future Work
What We Learned
Rate of change beats level for straddles. The z-score signal (Part I of this study) captures the urgency of an IV spike — the moment when option premium is most inflated relative to recent history. IVP captures a state (IV is high) without distinguishing between a fresh spike and a weeks-long plateau. Markets mean-revert from spikes faster than from plateaus.
IVP is a better directional signal than a straddle signal. The same IVP ≥ 50 entry condition produces Sharpe 1.45 for buying SPY shares (with tight SL) vs Sharpe 0.46 for selling straddles. Elevated IV is a better predictor of equity recovery than of volatility premium opportunities.
Stop-loss regime differs by strategy. Straddles need wide SL (40%) to avoid cutting positions during normal theta decay. Directional equity needs tight SL (1%) to survive the rare cases when a pullback extends into a sustained decline. The IVP signal fires during pullbacks, which makes tight equity SL essential.
Exit timing matters as much as entry. The IVP exit threshold sweep showed different optima by strategy: 20 (bottom quintile) for straddles, 30 for directional. The exit signal must match the strategy's time horizon — straddles need more time for theta/vega to work; equity positions should exit once the rebound is captured.
Potential Improvements
- Combined signal: Use z-score for straddle entry timing + IVP as a confirmation filter (only enter z-score signals when IVP > 50). This could reduce the z-score strategy's rare but large losses.
- IVP-only portfolio: Combine the directional equity strategy (Sharpe 1.45) with the straddle strategy to capture both the equity rebound and the volatility premium simultaneously.
- Regime-adaptive thresholds: Adjust IVP entry/exit thresholds based on the VIX regime (e.g., tighter exit in low-vol environments).
4. Data and Reproducibility
This study uses the same data sources as Part I of this study: spy_iv_study_article_part1.md:
- IVX data:
/equities/eod/ivxwithsymbol=SPY— provides IVX at all tenors (7d–180d) with Call, Put, and Mean values - IV Percentile: Self-computed rolling window percentile from IVX 30-day Mean IV (
iv_30d_mean) - Lookback: 252 trading days (1 year), computed as
lookback_period=361calendar days × 0.7
Backtest parameters:
- Asset: SPY (SPDR S&P 500 ETF)
- Period: February 24, 2021 – February 23, 2026
- Strategy: Sell ATM straddle, 10% position size
- DTE target: 90 days
- IVP entry: ≥ 50 (IV above historical median)
- IVP exit: < 20 (IV dropped to bottom quintile)
- Stop-loss: PL 40% (intraday, MINUTE_1)
- Profit target: 50% of premium collected
The backtesting framework (ivolatility_backtesting.py) and notebook (spy_iv_signal_backtest/backtest.ipynb) are available for reproducibility.
Disclaimer: This study is for informational and educational purposes only and does not constitute investment advice, a recommendation, or a solicitation to buy, sell, or hold any security, option, or financial instrument. Past performance and statistical findings do not guarantee future results. Options trading involves significant risk, including the potential for losses exceeding the initial investment. Always conduct your own due diligence and consult a qualified financial advisor before making any investment decisions.
Research and backtesting by IVOLAI. Analysis conducted using IVolatility.com data and API. SPY implied volatility indicators (IVX at all tenors) are calculated by IVolatility using a proprietary weighting technique factoring Delta and Vega of 8 ATM options per expiration, normalized to fixed tenors.