Do High Implied Volatility Indicators Predict Stock Price Declines? IVolAI Investigates
A Cross-Sectional Study of S&P 500 Stocks, 2021–2025
Summary
There is a widely held belief among options traders that stocks with extremely high implied volatility (IV) are headed for a crash. The logic is intuitive: when the options market is pricing in large expected moves, something bad must be coming. But is this actually true? Do stocks with the highest IV readings consistently underperform?
At IVolatility, we tasked our artificial intelligence backtesting assistant, IVolAI, with conducting a comprehensive cross-sectional analysis to rigorously test this hypothesis. Using five years of daily data across all S&P 500 stocks, IVolAI evaluated multiple implied volatility indicators and their forward performance characteristics.
Our main finding: the answer depends on which IV indicator you use — and it's far more nuanced than the simplistic "high IV = crash" narrative suggests.
This entire report, including statistical testing, robustness checks, and backtesting validation, was prepared by IVolAI.
Key Findings
- IV/HV Ratio (implied volatility divided by historical volatility) is the only indicator that shows consistent underperformance after a high reading: -0.29% below baseline at 20 days, -0.72% at 30 days. This effect is statistically significant.
- IVX30 Raw (absolute implied volatility level) actually shows the opposite — stocks with the highest absolute IV levels gained an average +5.09% over 20 days. But this is misleading: it's driven by "crash survivors" like CVNA and SMCI that had extreme IV during distress and then rebounded.
- IV Rank and IV Percentile show no reliable predictive power. Their results are indistinguishable from random noise.
- Year-to-year consistency is poor. No indicator works reliably every year. The IV/HV Ratio was negative in 4 out of 5 years, but by small and varying amounts.
- The time window matters. We tested five IV/HV ratio variants from IVX7/HV10 to IVX60/HV30. Using a composite score that avoids cherry-picking horizons, IVX14/HV10 (14-day implied vs 10-day realized) emerged as the best all-round predictor, while IVX60/HV30 showed the most year-to-year consistency.
- Backtest validation (Section 10): Trading the signal over 5 years with 313 symbols and 8,818 trades across two strategies: selling naked ATM options on high-IV/HV stocks breaks even at 30-day hold (PF 1.00, 73% win rate) with extreme tail risk, while short stock loses money consistently (PF 0.69). The -0.29% statistical edge is real but too small to trade profitably on individual names — contrast this with the same type of signal applied to SPY (Part II), which produced +61% returns.
1. What We Studied
The Question
When a stock has one of the highest implied volatility readings in the S&P 500 on a given day, what happens to its price over the next 1 to 30 trading days?
The Indicators
We tested four different measures of "high implied volatility," each capturing something different:
| Indicator | What It Measures | Range | Interpretation |
|---|---|---|---|
| IV/HV Ratio (IVX30/HV20) | How much the options market's expectations exceed recent actual stock movement | 0 to ~6 | A ratio of 2.0 means the options market expects twice the movement that the stock has actually shown |
| IV Rank (IVR30) | Where today's IV sits relative to its range over the past year | 0 to 100 | IVR = 90 means today's IV is near the top of its 12-month range |
| IV Percentile (IVP30) | What percentage of days in the past year had lower IV than today | 0 to 100 | IVP = 95 means only 5% of days in the past year had higher IV |
| IVX30 Raw | The absolute level of 30-day implied volatility | 5 to 300+ | Higher numbers mean the market expects bigger price moves |
These indicators are related but not the same. A stock can have high absolute IV (IVX30) but a low IV Rank if it always trades with high IV. Conversely, a normally quiet stock might have a high IV Rank even when its absolute IV is modest. The IV/HV Ratio specifically measures the gap between what the market expects and what is actually happening.
The Data
- Universe: All S&P 500 stocks (520 unique tickers over the period)
- Period: February 24, 2021 to December 31, 2025 (1,220 trading days)
- Source: IVolatility.com
/equities/stock-market-dataAPI endpoint (pre-computed daily indicator values) - Total data points: 606,343 stock-days (520 stocks × ~1,220 days)
- Signal events: 6,100 per indicator (5 stocks × 1,220 days)
The Method
Every trading day, we:
- Ranked all ~500 S&P 500 stocks by each indicator
- Selected the top 5 stocks (those with the highest readings)
- Measured their forward returns at 1, 3, 5, 7, 10, 20, and 30 trading days
We then compared these "high-IV" stock returns against a baseline: the average forward return of all S&P 500 stocks for the same period and year. The baseline resets each year to account for bull/bear market conditions — comparing a 2022 bear market signal against 2021 bull market averages would be misleading.
This creates a simple but powerful question: did stocks flagged by each indicator do better or worse than the average S&P 500 stock over the same period?
2. Overall Results
The chart below shows the mean forward return at each time horizon for stocks flagged by each indicator, compared to the S&P 500 baseline:
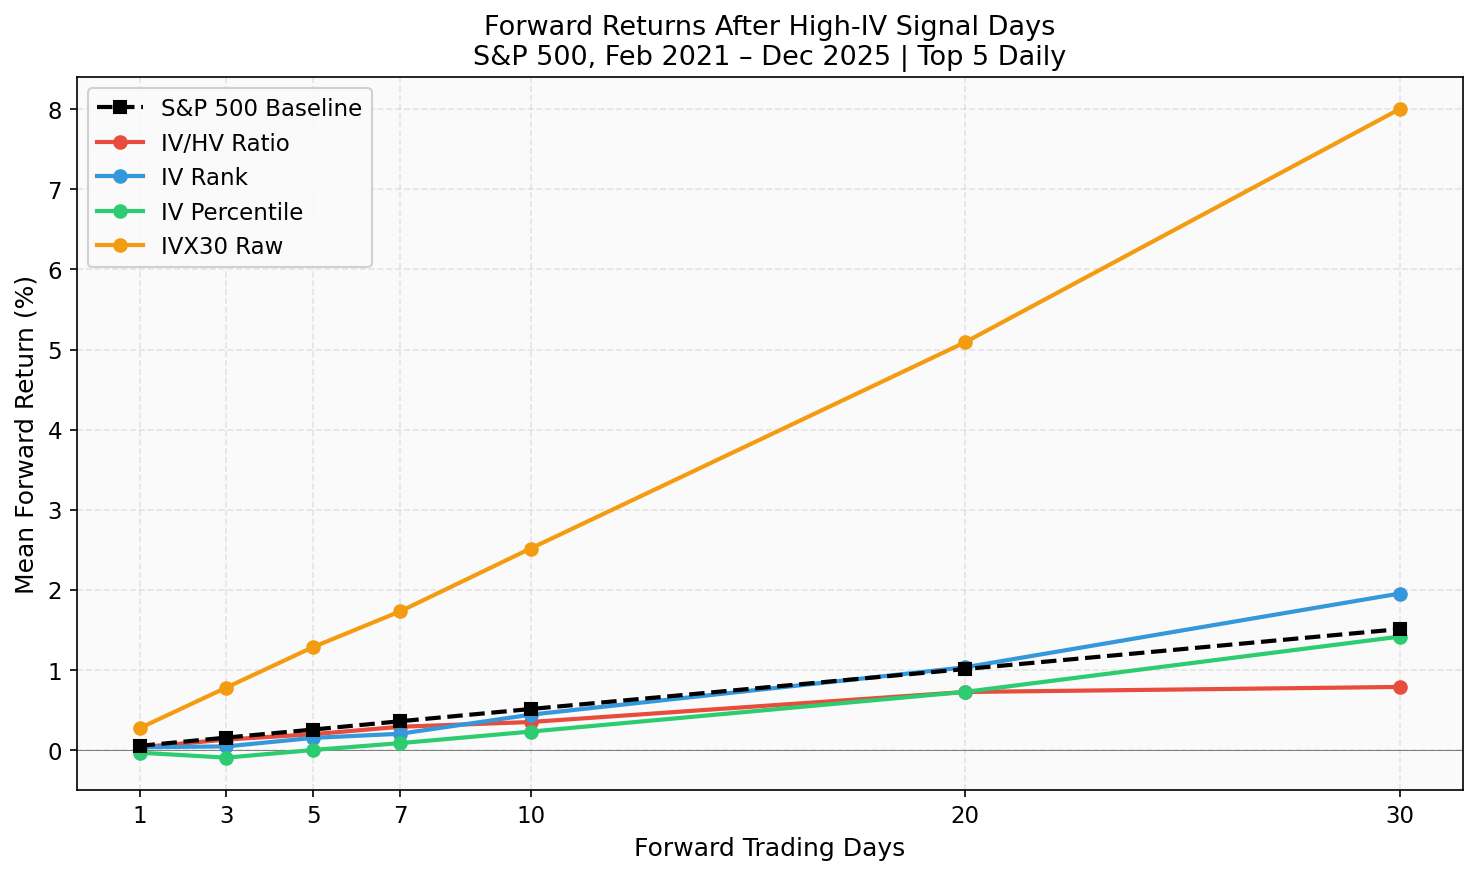
Figure 1: Mean forward returns after a high-IV signal. The black dashed line is what an average S&P 500 stock earned. Lines above the baseline outperformed; lines below underperformed.
The most striking observation: IVX30 Raw (orange) dramatically outperforms, while IV/HV Ratio (red) steadily falls below baseline as the horizon extends. IV Rank and IV Percentile track close to baseline.
But raw performance can be misleading. What matters is the excess return — how much better or worse than the average stock:
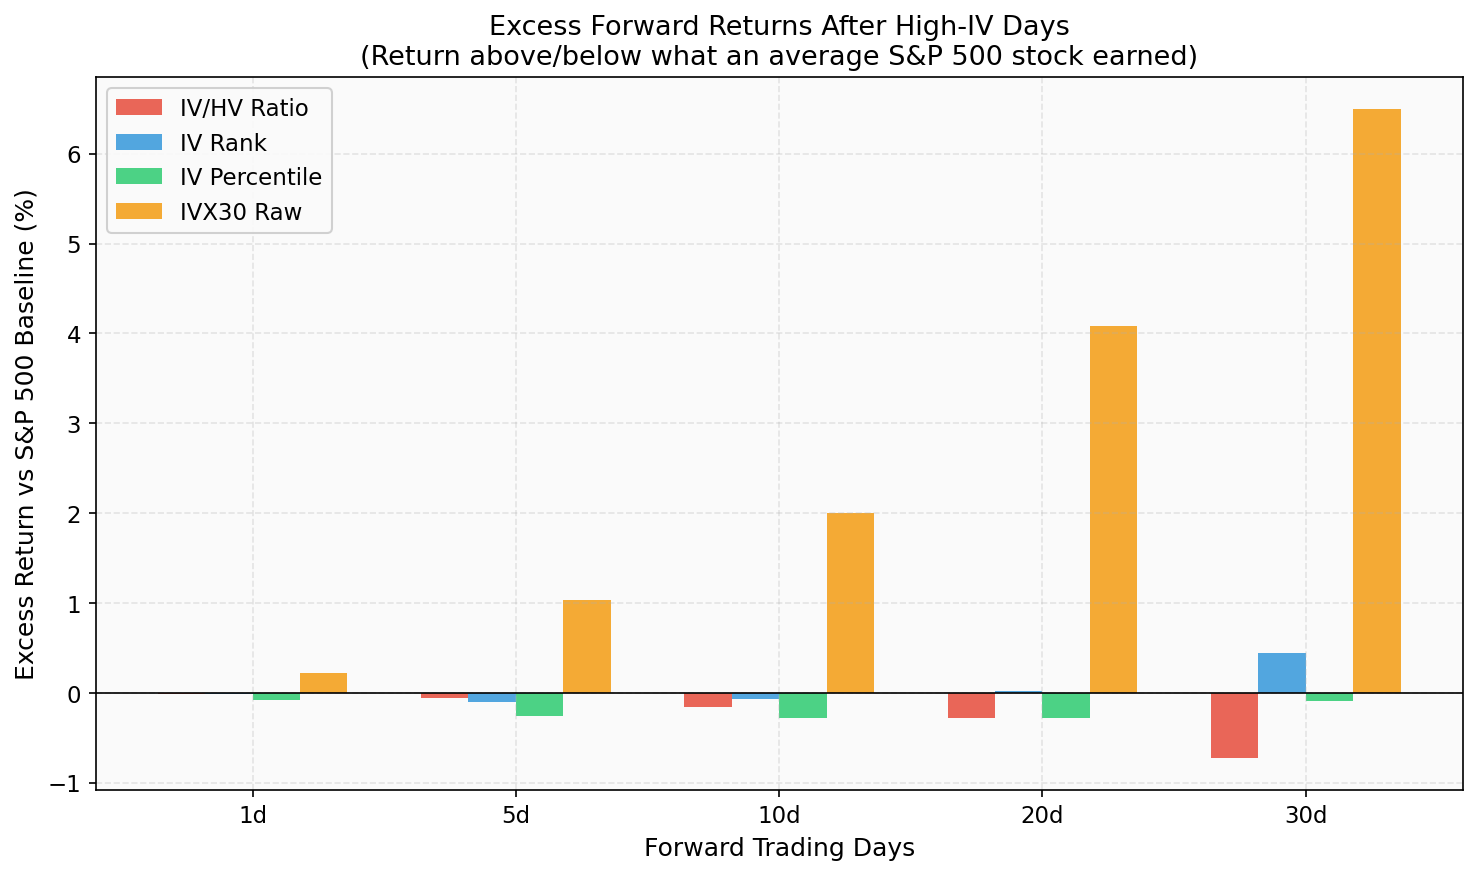
Figure 2: Excess return vs S&P 500 baseline. Negative bars mean high-IV stocks underperformed the average stock.
Full Statistics
| Indicator | Horizon | Mean Return | vs Baseline | Median | % Negative | Avg Loss | Avg Win |
|---|---|---|---|---|---|---|---|
| IV/HV Ratio | 1d | +0.03% | -0.02% | +0.05% | 47.8% | -1.50% | +1.46% |
| 5d | +0.20% | -0.06% | +0.29% | 46.4% | -3.82% | +3.68% | |
| 10d | +0.35% | -0.16% | +0.34% | 46.8% | -5.34% | +5.36% | |
| 20d | +0.72% | -0.29% | +0.62% | 46.5% | -7.32% | +7.72% | |
| 30d | +0.79% | -0.72% | +0.73% | 47.0% | -8.46% | +9.00% | |
| IV Rank | 20d | +1.03% | +0.02% | +0.47% | 48.4% | -9.58% | +11.00% |
| 30d | +1.95% | +0.44% | +0.64% | 47.8% | -10.60% | +13.46% | |
| IV Percentile | 20d | +0.72% | -0.29% | +0.46% | 48.4% | -9.28% | +10.11% |
| 30d | +1.41% | -0.09% | +0.60% | 48.0% | -10.19% | +12.14% | |
| IVX30 Raw | 20d | +5.09% | +4.08% | +1.33% | 47.4% | -15.98% | +24.08% |
| 30d | +8.00% | +6.50% | +2.67% | 46.2% | -18.91% | +31.13% |
Notice the IVX30 Raw indicator: mean +5.09% at 20 days but median only +1.33%. That's a massive gap, meaning a few extreme winners (stocks bouncing back from crashes) are pulling the average up. More on this in Section 5.
3. Year-by-Year Consistency
A signal that only works in certain years is unreliable. The heatmap below shows excess returns (vs that year's baseline) for each indicator, broken down by year and horizon:
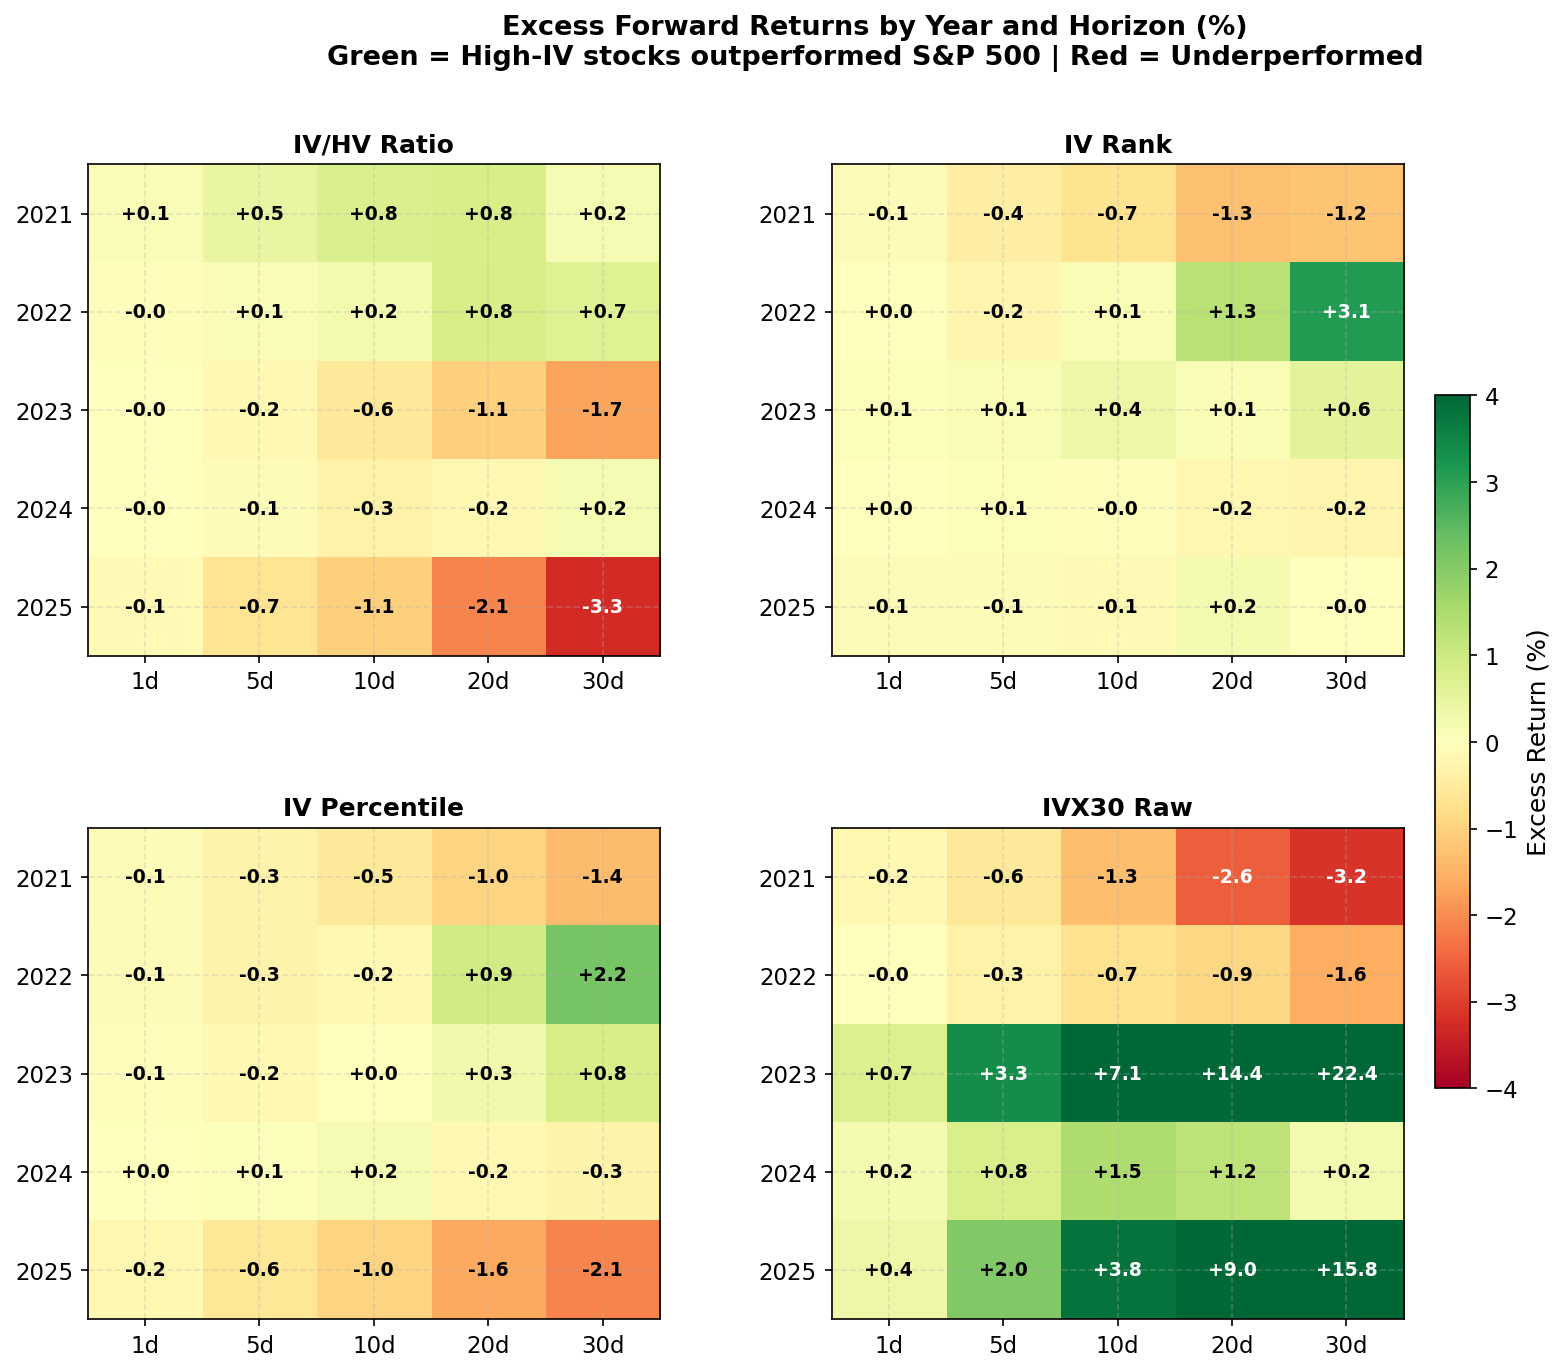
Figure 3: Excess forward returns by year and horizon. Green cells = high-IV stocks beat the S&P 500 average. Red cells = they underperformed. Values are in percentage points.
What the heatmap reveals:
IV/HV Ratio (top-left): Consistently red (negative) across most cells, especially at 20d and 30d. This is the most directionally consistent indicator. The strongest underperformance was in 2025 (-3.3% at 30d) and 2023 (-1.7% at 30d). Only 2022 showed slight outperformance at longer horizons.
IV Rank (top-right): Mixed results. Strongly positive in 2022 (stocks flagged during the selloff bounced back) but slightly negative in 2021 and 2024. No consistent pattern.
IV Percentile (bottom-left): Similar to IV Rank but slightly more negative. Positive in 2022, negative in most other years.
IVX30 Raw (bottom-right): Dominated by two extreme years: 2023 (+22.4% at 30d!) and 2025 (+15.8% at 30d). These outlier years completely drive the overall positive result. In 2021 and 2022, IVX30 Raw actually showed negative returns.
Per-Year Baseline Returns
To understand the context, here are the baseline (average S&P 500 stock) 20-day forward returns per year:
| Year | Baseline 20d | Market Context |
|---|---|---|
| 2021 | +1.05% | Strong bull market |
| 2022 | +0.00% | Bear market (Fed tightening) |
| 2023 | +1.80% | Recovery rally |
| 2024 | +0.82% | AI-driven bull market |
| 2025 | +1.40% | Tariff volatility + recovery |
4. Statistical Significance
Are these results real or just random noise? We applied three statistical tests, each with different assumptions:
- Welch's t-test — The standard test. Assumes returns are normally distributed (they aren't perfectly, but it's a reasonable approximation with 6,000+ observations).
- Mann-Whitney U test (Wilcoxon rank-sum) — Does not assume any distribution. Simply asks: are the signal returns systematically shifted compared to baseline returns?
- Bootstrap confidence interval — Takes no assumptions at all. Resamples the signal returns 10,000 times and computes the range of plausible excess returns.
20-Day Forward Return Results
| Indicator | Excess Return | t-test p | Wilcoxon p | Bootstrap 95% CI | Verdict |
|---|---|---|---|---|---|
| IV/HV Ratio | -0.29% | 0.034 | 0.044 | [-0.55%, -0.02%] | STRONG |
| IV Rank | +0.02% | 0.908 | 0.015 | [-0.35%, +0.39%] | weak |
| IV Percentile | -0.29% | 0.118 | 0.001 | [-0.64%, +0.07%] | weak |
| IVX30 Raw | +4.08% | <0.001 | <0.001 | [+3.38%, +4.79%] | STRONG |
"STRONG" = all three tests agree the effect is real (p < 0.05 for both parametric and non-parametric tests, and bootstrap CI excludes zero). "Weak" = only some tests significant.
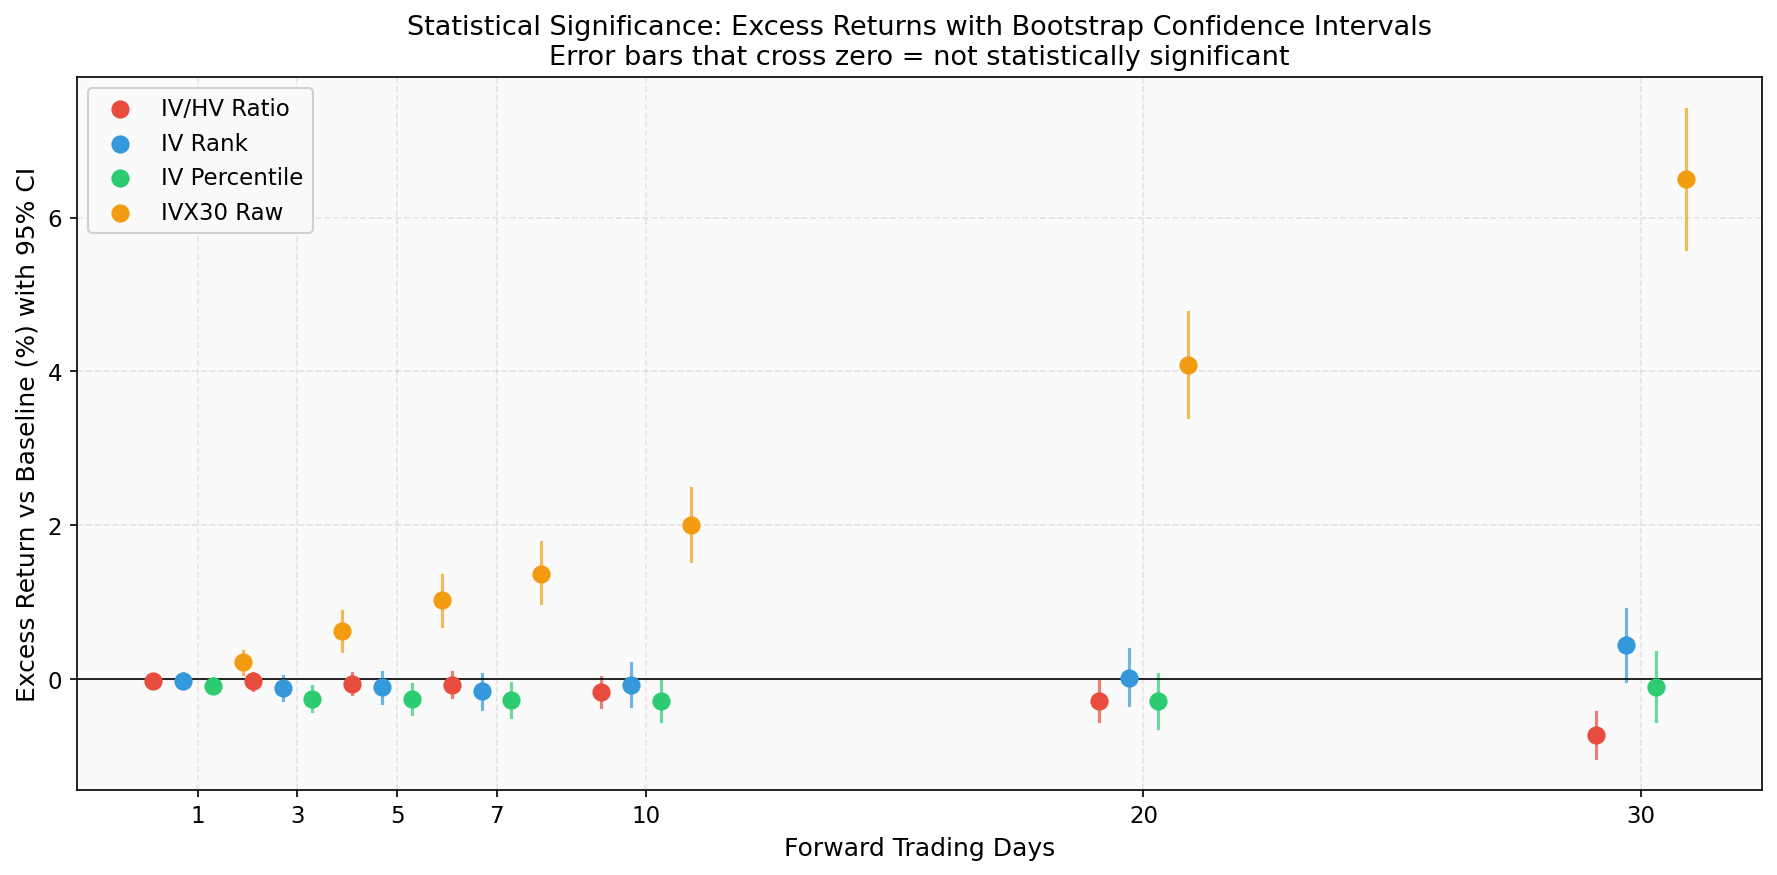
Figure 4: Excess returns with 95% bootstrap confidence intervals. Error bars that cross the zero line indicate the result is not statistically significant at that horizon.
Across All Horizons (t-test significance)
| Indicator | 1d | 3d | 5d | 7d | 10d | 20d | 30d |
|---|---|---|---|---|---|---|---|
| IV/HV Ratio | -0.02 | -0.02 | -0.06 | -0.07 | -0.16 | -0.29* | -0.72* |
| IV Rank | -0.02 | -0.11 | -0.10 | -0.16 | -0.07 | +0.02 | +0.44 |
| IV Percentile | -0.08 | -0.25 | -0.26* | -0.27* | -0.28* | -0.29 | -0.09 |
| IVX30 Raw | +0.22 | +0.63 | +1.03 | +1.37 | +2.00 | +4.08 | +6.50** |
Stars indicate statistical significance: * p<0.05, p<0.01, * p<0.001. Values are excess returns in percentage points.
Key insight: The IV/HV Ratio effect builds over time — barely visible at 1 day but growing to -0.72% at 30 days. This is consistent with a gradual price adjustment story, not a sudden crash.
5. Why IVX30 Raw Shows Positive Returns (The Survivor Bias Problem)
The IVX30 Raw result (+4.08% excess at 20d) seems to contradict the "high IV = crash" hypothesis. But look at the distribution:
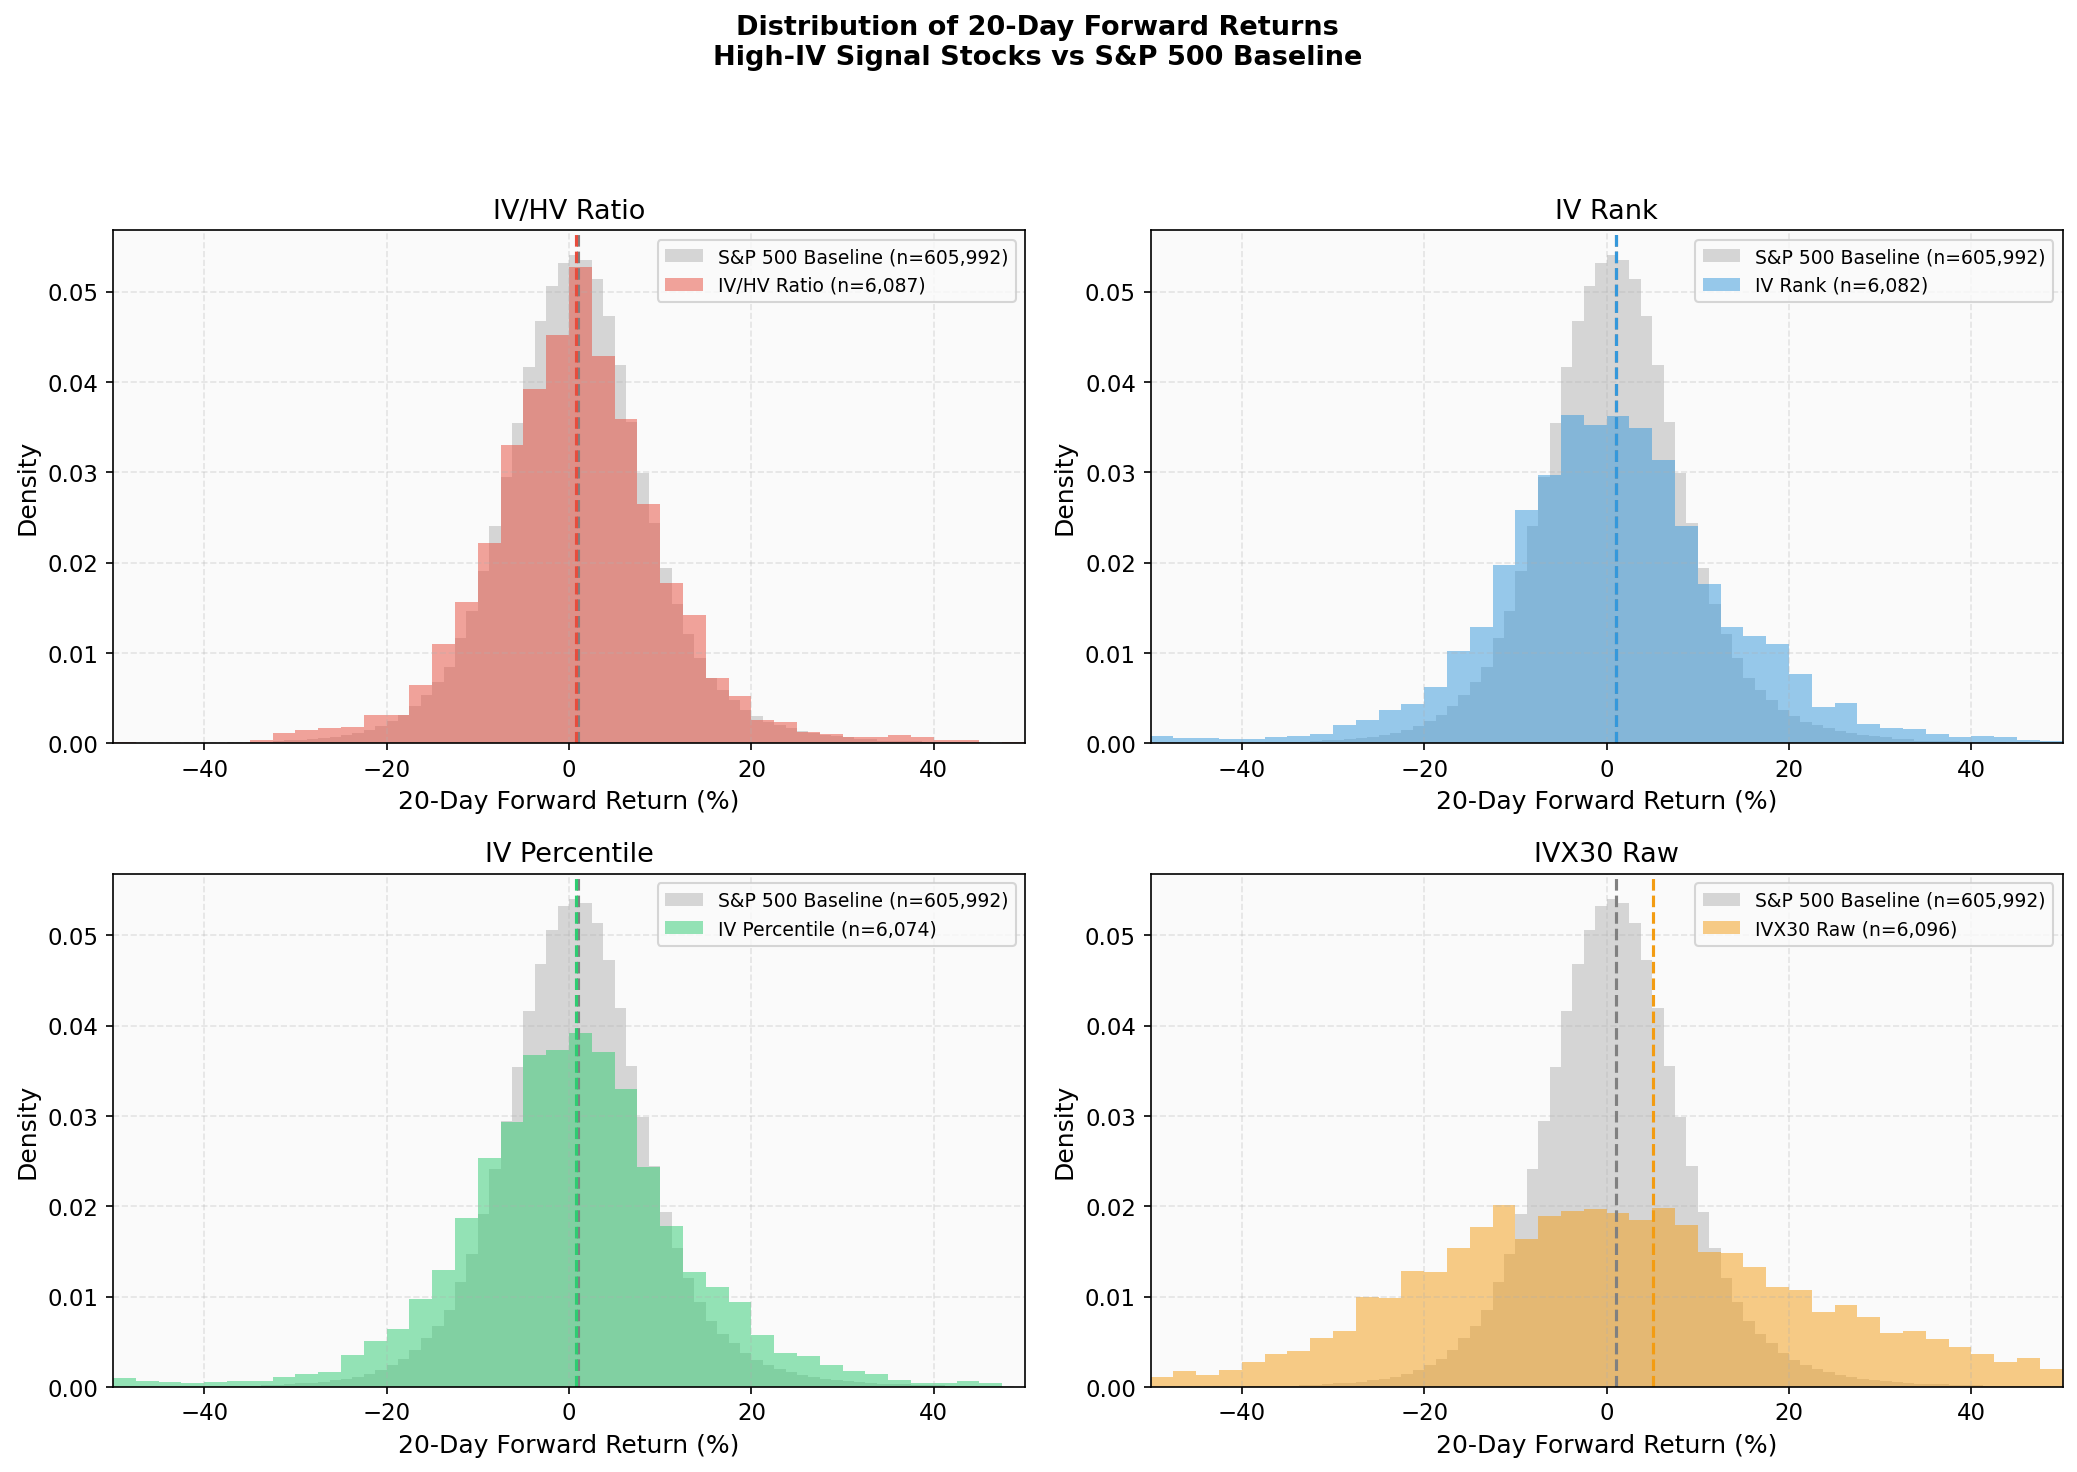
Figure 5: Distribution of 20-day forward returns. The IVX30 Raw panel (bottom-right) shows a much wider distribution with a long right tail, indicating extreme positive outliers.
The IVX30 Raw distribution has much fatter tails than the others. The median return is only +1.33% while the mean is +5.09% — classic skew from outliers.
The Crash Survivor Effect
Stocks that reach extremely high absolute IV levels (IVX30 > 100%) are typically in genuine distress — bankruptcy risk, regulatory investigations, massive earnings misses. Some of these stocks do crash permanently. But many of them — especially those that remain in the S&P 500 — eventually recover, and the bounce-back is enormous.
The top appearances in our dataset illustrate this perfectly:
| Stock | Signal Appearances | Avg 20d Return | Story |
|---|---|---|---|
| CVNA (Carvana) | 933 | +7.65% | Near-bankruptcy in 2022-23, then recovered 3,000%+ |
| COIN (Coinbase) | 839 | +4.16% | Crypto winter → crypto recovery |
| SMCI (Super Micro) | 813 | +7.23% | Accounting concerns → AI boom recovery |
| APP (AppLovin) | 774 | +5.71% | High-growth volatility → strong rally |
| HOOD (Robinhood) | 524 | -1.53% | IPO bust, one of the few persistent losers |
| DLTR (Dollar Tree) | 335 | -4.91% | Fundamental deterioration, genuine crash |
| DG (Dollar General) | 257 | -6.33% | Similar to DLTR — true high-IV crash case |
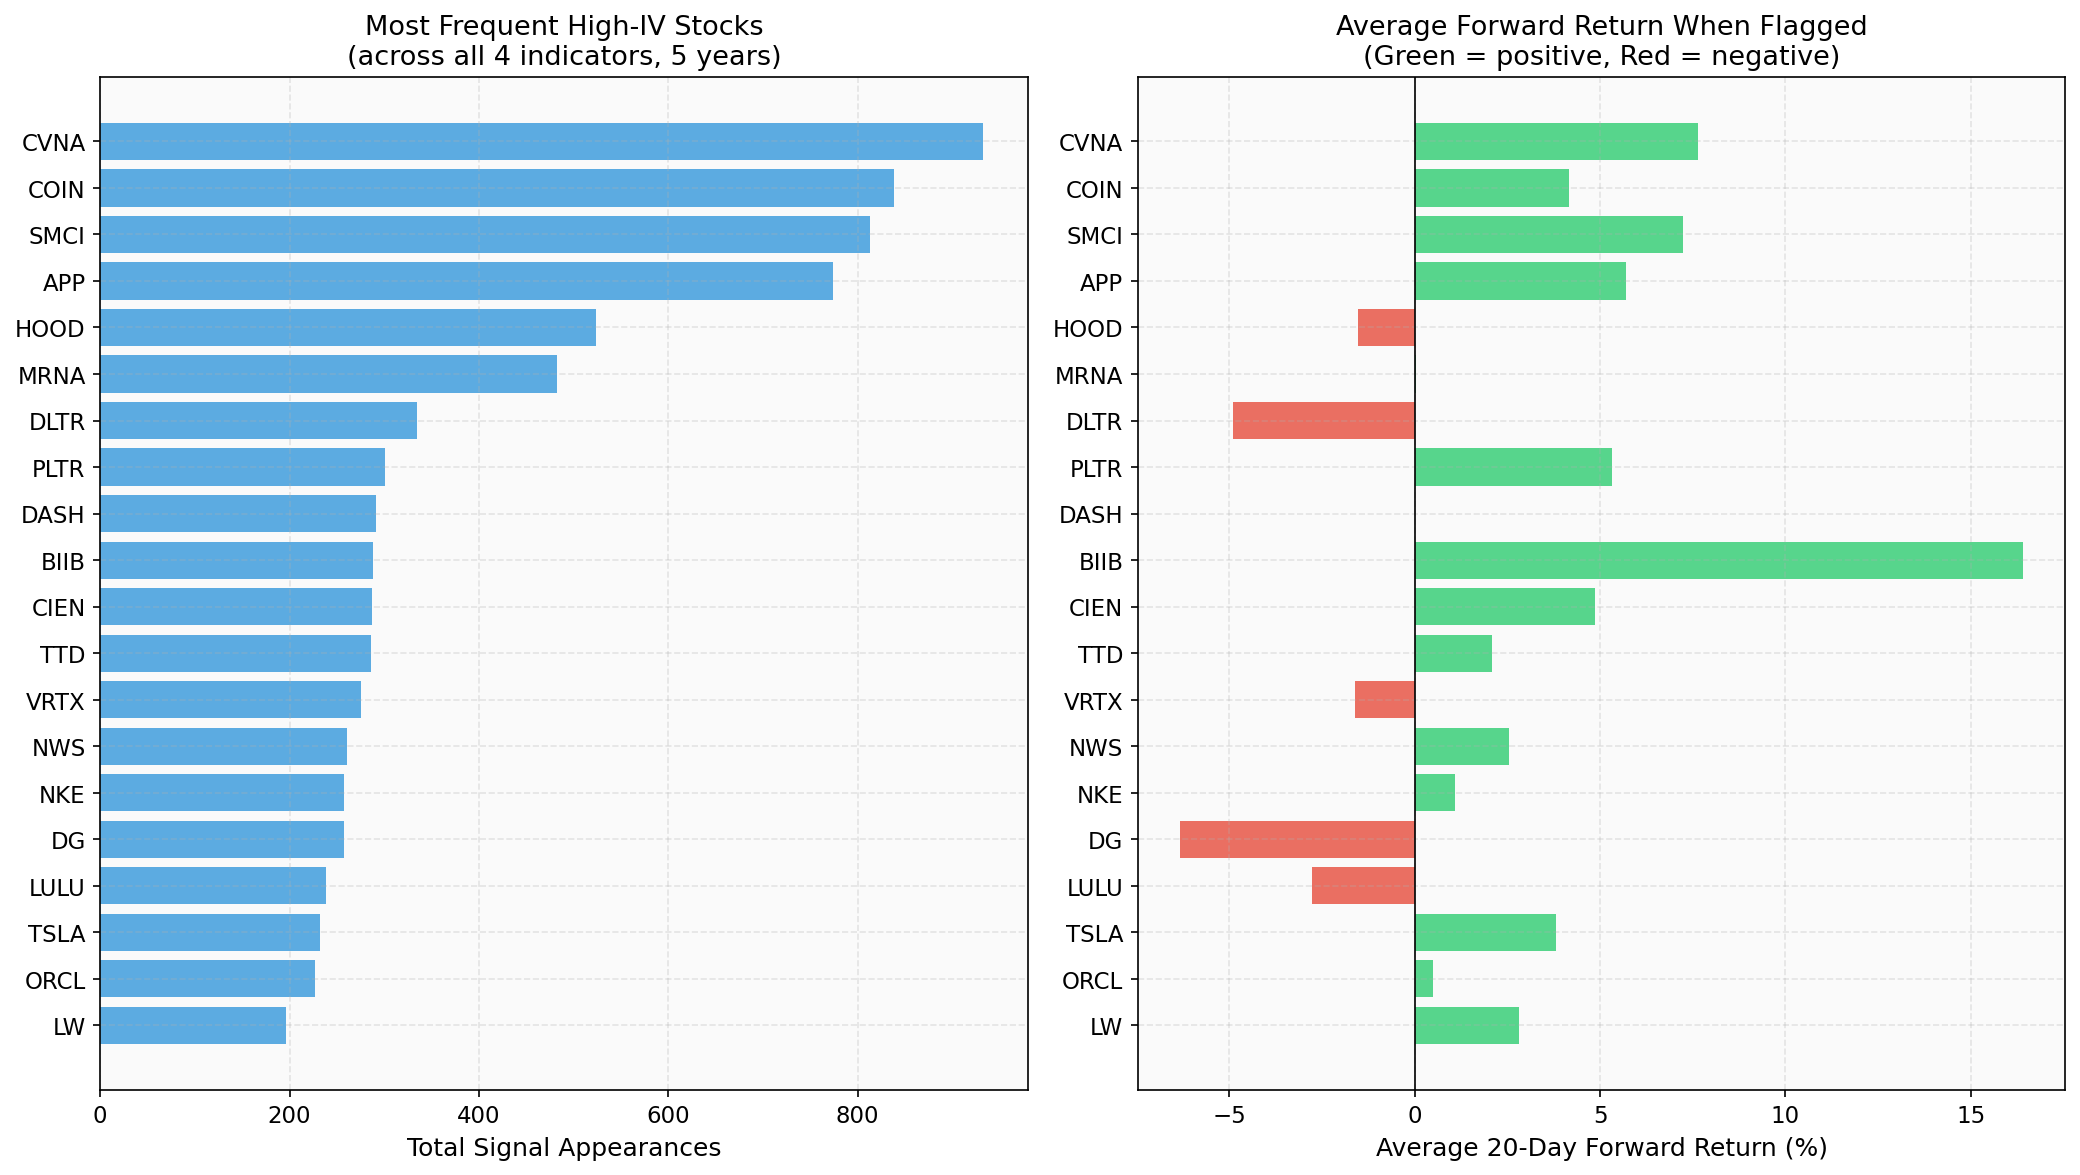
Figure 6: Most frequent high-IV stocks and their average forward returns. Green = positive, Red = negative. The biggest winners (CVNA, BIIB) dramatically outweigh the losers.
CVNA alone appeared 933 times in our signal database. When it had IVX30 > 200% in early 2023, it was a $4 stock. Twenty trading days later it would regularly be up 30-40%. These extreme recovery events dominate the IVX30 Raw average.
This is survivorship bias at work. We're studying S&P 500 stocks — companies that were already large enough to be in the index. Companies that crash and get delisted leave the sample. Companies that crash and recover generate massive positive returns. The IVX30 Raw indicator is picking up the "crash and bounce" pattern, not a genuine predictive signal.
Excluding Extreme Events
To test this, we excluded several volatile periods:
| Exclusion Window | IV/HV Ratio 20d | IVX30 Raw 20d | Change for IVX30 |
|---|---|---|---|
| None (full sample) | +0.72% | +5.09% | — |
| Apr 2025 tariffs removed | +0.75% | +4.93% | -0.16% |
| Jan 2022 selloff removed | +0.76% | +5.20% | +0.11% |
| Oct 2022 bottom removed | +0.71% | +5.37% | +0.28% |
The IV/HV Ratio result is remarkably stable across exclusions. IVX30 Raw is more sensitive — removing the October 2022 bottom (when crash survivors started bouncing) actually makes it look better, confirming that the positive result comes from broad mean-reversion rather than any single event.
6. Do the Indicators Agree?
An important question: when IV/HV Ratio says "this stock has extreme IV," does IV Rank say the same thing? If different indicators flag different stocks, they may be measuring different phenomena.
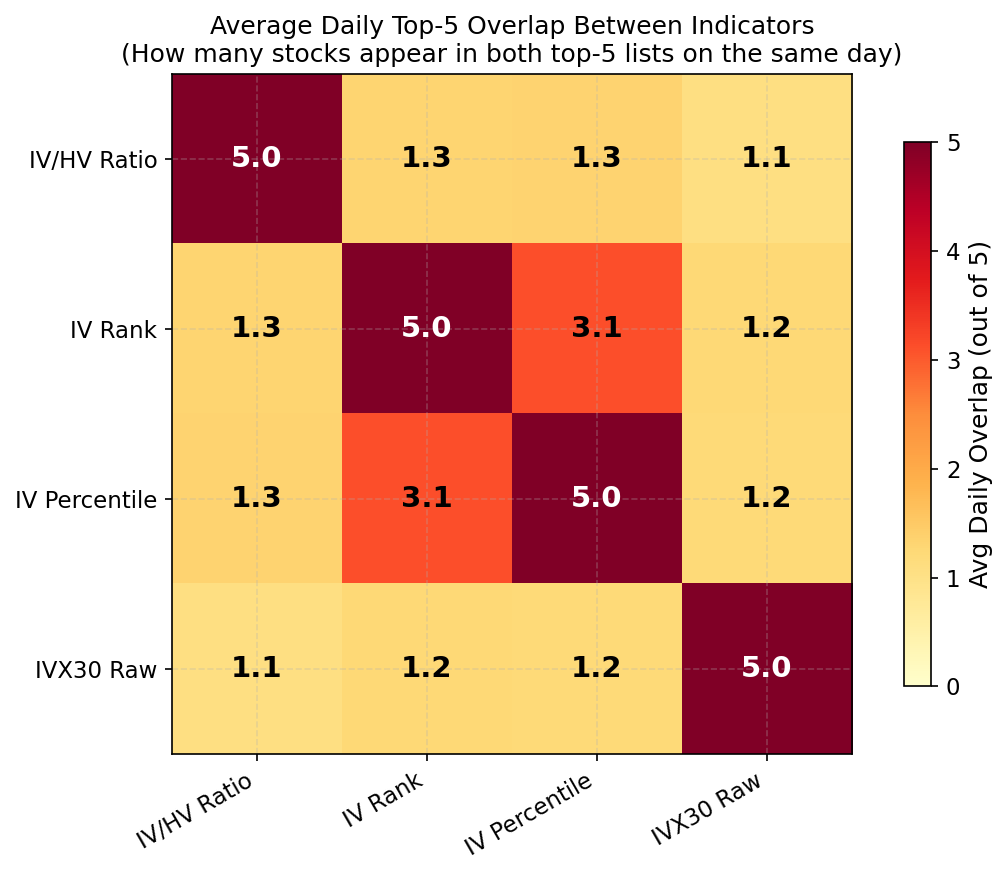
Figure 7: Average daily overlap between top-5 lists. Each cell shows how many stocks (out of 5) appear in both indicators' top-5 on the same day. A value of 5.0 = perfect overlap, 1.0 = random.
Key findings:
- IV Rank and IV Percentile overlap heavily (3.1 out of 5 stocks overlap daily). This makes sense — they measure similar things (where IV stands relative to its history).
- IV/HV Ratio has minimal overlap with everything (1.1–1.3). It's capturing genuinely different stocks — those where implied vol exceeds realized vol, regardless of the absolute level.
- IVX30 Raw is the most independent (1.1–1.2 overlap). Stocks with the highest absolute IV levels aren't necessarily the ones with the highest rank or ratio.
This explains why IV/HV Ratio gives different results from the others: it's selecting different stocks. A stock with 30% IV but only 10% recent historical vol (ratio = 3.0) will be flagged by IV/HV Ratio but not by the other indicators if its IV is average for its history. This is precisely the situation where the options market is "overpricing" the stock relative to what's actually happening — and our data suggests these stocks do underperform.
7. Ratio Term Structure: Does the IV/HV Time Window Matter?
Having established that the IV/HV Ratio is the most reliable predictor, we asked a natural follow-up question: does the time window of the ratio matter? Our standard ratio (IVX30/HV20) compares 30-calendar-day implied volatility against 20-trading-day historical volatility. But IVolatility also provides shorter-term IVX at 7, 14, and 21 calendar days, and we have HV10 (10 trading days) and HV30 (30 trading days) available.
We constructed five ratio variants:
| Ratio | IV Window | HV Window | What it captures |
|---|---|---|---|
| IVX7/HV10 | 7 calendar (~5 trading) | 10 trading days | Very short-term vol gap |
| IVX14/HV10 | 14 calendar (~10 trading) | 10 trading days | Short-term vol gap |
| IVX21/HV10 | 21 calendar (~15 trading) | 10 trading days | Medium-short vol gap |
| IVX30/HV20 | 30 calendar (~21 trading) | 20 trading days | Standard (Part I study) |
| IVX60/HV30 | 60 calendar (~42 trading) | 30 trading days | Longer-term vol gap |
The hypothesis was intuitive: shorter ratios should predict shorter forward returns, and longer ratios should predict longer horizons. The data partially confirmed this — with a surprise.
Excess Return by Ratio and Horizon
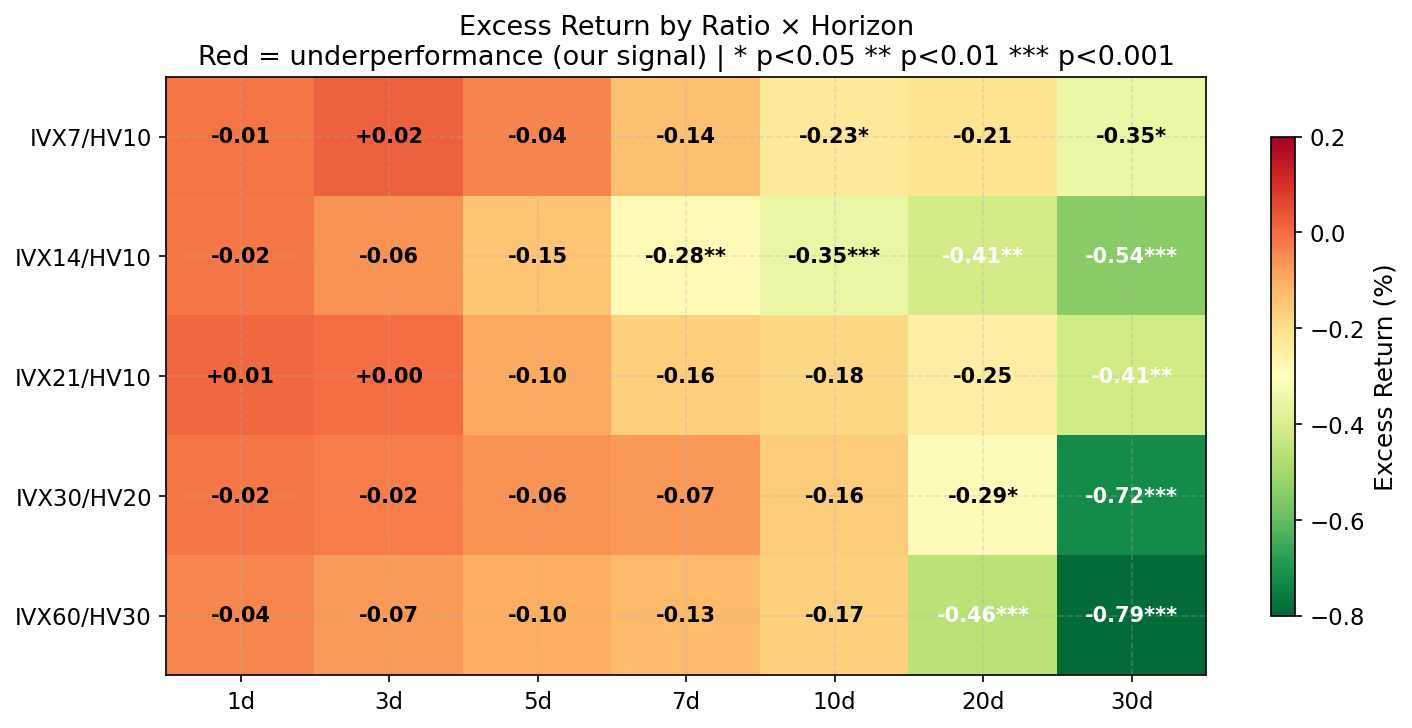
Figure 8: Excess forward return for each ratio at each horizon. Darker green cells indicate stronger underperformance (our signal). Stars show statistical significance.
The heatmap reveals a clear pattern:
- IVX14/HV10 is significant earliest — from 7d onward (p < 0.01). It's the best all-around predictor with the highest average excess return across all horizons (-0.26%).
- IVX60/HV30 and IVX30/HV20 dominate at 20-30 days — the strongest single-horizon effects (-0.79% and -0.72% at 30d).
- IVX7/HV10 is too noisy — the 7-day IV term captures too much weekly expiration noise.
- IVX21/HV10 underperforms — oddly, it's weaker than both its neighbors (IVX14 and IVX30).
Composite Scoring: A Fair Comparison
Comparing ratios at cherry-picked horizons (e.g., "IVX14/HV10 wins at 7d") is misleading. To compare fairly, we designed a composite score with three components:
- Average Excess Return (40% weight): Mean excess across all 7 horizons. A ratio that works at every horizon scores higher than one that only works at 30d.
- Significance Breadth (30% weight): How many of the 7 horizons show statistical significance (p < 0.05). More significant horizons = more robust signal.
- Year Consistency (30% weight): What percentage of the 5 years showed negative excess at 20d. A ratio that underperforms in 5/5 years is more reliable than one that only works in 3/5 years.
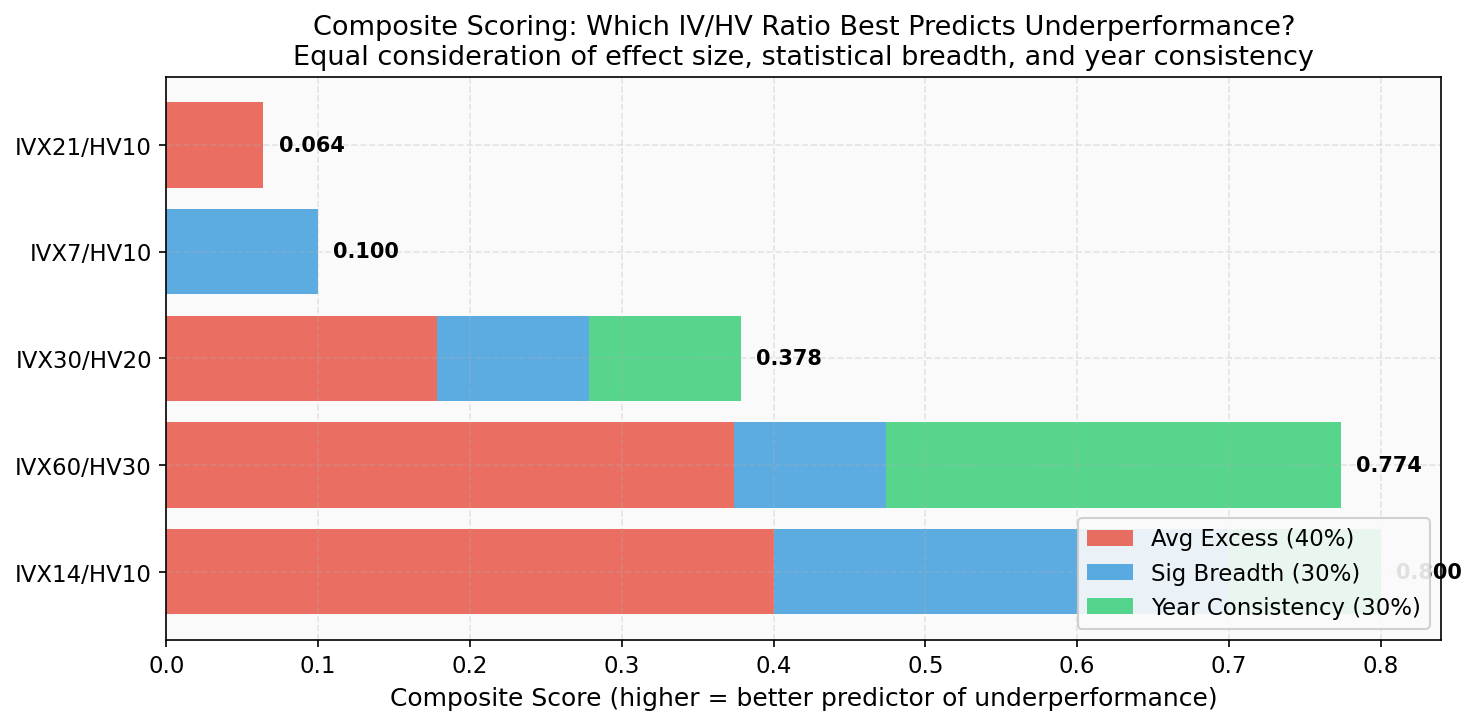
Figure 9: Composite scoring of all five ratio variants. Higher score = better predictor of underperformance. Red = excess return component, blue = significance breadth, green = year consistency.
| Ratio | Avg Excess | Sig Horizons | Years Negative | Combined Score |
|---|---|---|---|---|
| IVX14/HV10 | -0.259% | 4/7 | 60% | 0.800 |
| IVX60/HV30 | -0.251% | 2/7 | 100% | 0.774 |
| IVX30/HV20 | -0.191% | 2/7 | 60% | 0.378 |
| IVX7/HV10 | -0.137% | 2/7 | 40% | 0.100 |
| IVX21/HV10 | -0.157% | 1/7 | 40% | 0.064 |
IVX14/HV10 wins (0.800), narrowly beating IVX60/HV30 (0.774). The two winners have complementary strengths:
- IVX14/HV10 excels in significance breadth (4/7 horizons significant) and average effect size.
- IVX60/HV30 excels in year consistency (negative all 5 years) but is only significant at 2 horizons.
The standard IVX30/HV20 lands in the middle — decent but outperformed by both the shorter and longer alternatives.
Different Stocks, Different Signal
The overlap analysis shows that these ratios are not just trivially repackaging the same information:
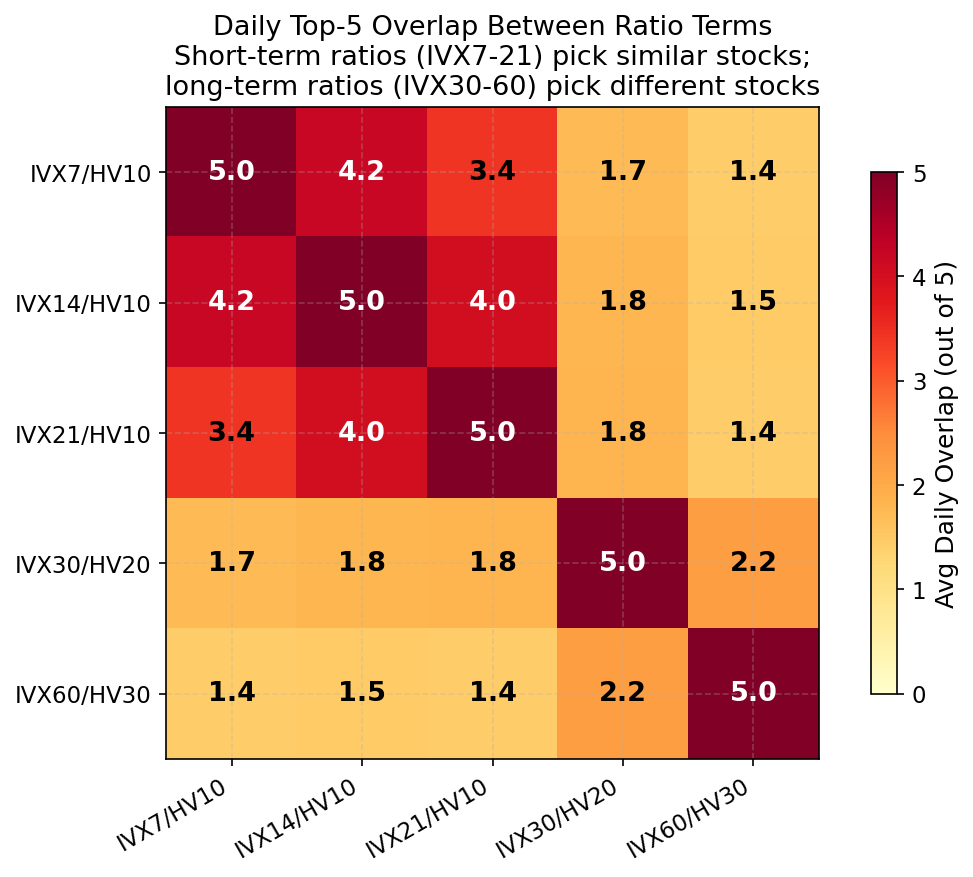
Figure 10: Average daily top-5 overlap between ratio variants. Short-term ratios (IVX7-21/HV10) pick similar stocks to each other but very different stocks from IVX30/HV20 and IVX60/HV30.
IVX7/HV10 and IVX14/HV10 share 4.2 out of 5 stocks daily — nearly identical selections. But they share only 1.8 stocks with IVX30/HV20. The short-term ratios are selecting stocks where the implied-realized gap is concentrated in the very near term: the market expects imminent movement that hasn't materialized yet.
Year-to-Year Stability
The critical weakness of all these signals is year-to-year variability:
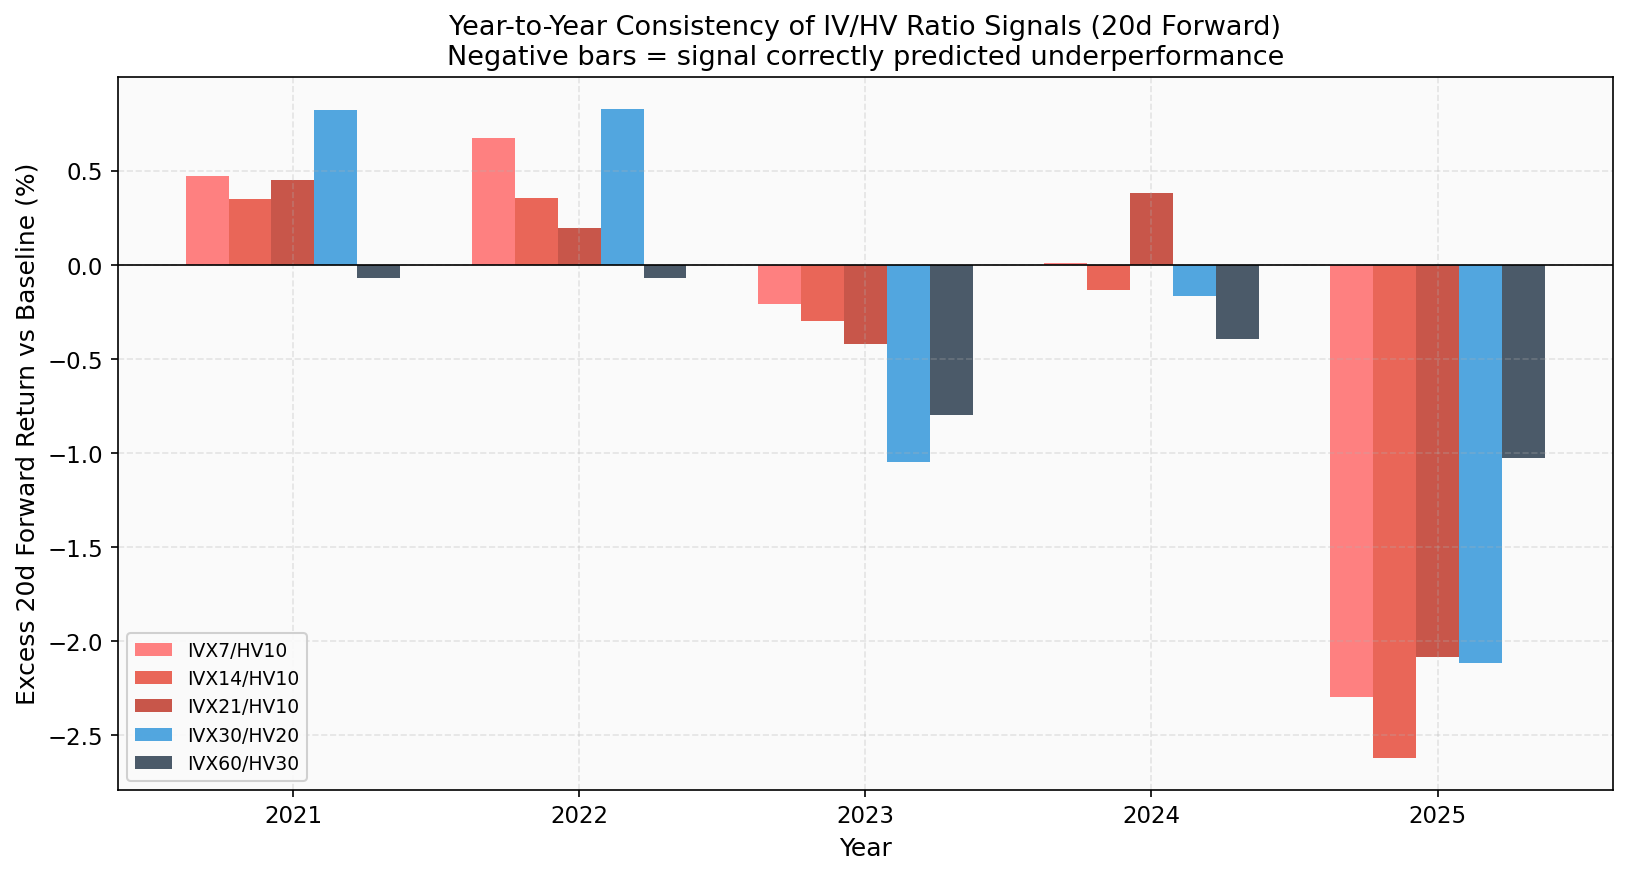
Figure 11: Per-year excess return at 20d for each ratio. Negative bars (below zero) mean the signal correctly predicted underperformance that year.
IVX60/HV30 is the most stable — negative in all 5 years, with a standard deviation of just 0.39% across years. IVX14/HV10 has larger effects when it works but was positive in 2021 and 2022 (std = 1.11%). For risk-averse applications, IVX60/HV30's consistency may matter more than IVX14/HV10's larger average effect.
Practical Recommendation
For practitioners who need a single ratio:
- Short-term signal (7-10 day horizon): Use IVX14/HV10
- Medium-term signal (20-30 day horizon): Use IVX60/HV30
- General purpose: IVX14/HV10 has the best composite score, but IVX60/HV30 is more year-consistent
Combining both (e.g., requiring agreement between a short-term and long-term ratio) could further improve the signal, though this was not tested in the current study.
8. Practical Implications
For Options Sellers
The data supports a cautious interpretation: stocks with high IV/HV Ratio are statistically more likely to underperform the market over the next 20-30 trading days. The effect size is small (-0.29% at 20d with IVX30/HV20, improving to -0.41% with IVX14/HV10) but consistent. This is compatible with a short premium strategy — selling options on stocks where IV significantly exceeds realized vol — but the edge is modest. Using IVX14/HV10 for shorter-dated positions and IVX60/HV30 for longer-dated positions may improve timing.
For Stock Traders
The popular narrative "high IV = crash incoming" is too simplistic. Most stocks with high IV readings just continue their normal trajectory. The average win (+7.72% at 20d) is actually larger than the average loss (-7.32% at 20d) for IV/HV Ratio signals. The underperformance comes not from crashes but from slightly more losers than winners and slightly smaller wins — consistent with a market that slightly overestimates future moves.
What Doesn't Work
- Using IV Rank alone does not predict forward returns. IVR = 100 is not a sell signal.
- Using absolute IVX30 levels as a crash indicator is dangerous — the stocks with the highest absolute IV are often in distress situations where recovery (not further decline) is more common.
- Short-term (1-5 day) prediction is nearly impossible with any of these indicators. The signal only becomes meaningful at 10+ day horizons.
Caveats
- Small effect size. -0.29% excess at 20 days is real but small. After transaction costs, it may not be profitable as a standalone signal.
- Year-to-year inconsistency. The IV/HV Ratio effect was negative in 4/5 years but the magnitude varied greatly.
- Top-5 selection is arbitrary. We chose the top 5 stocks daily. Different cutoffs (top 10, top 20, or using a threshold like ratio > 2.0) might give different results.
- S&P 500 only. Small-cap stocks with high IV might behave very differently.
- No earnings control. Many high-IV stocks are approaching earnings dates. Some of the forward return movement may reflect earnings reactions rather than IV mean reversion.
9. Methodology Notes
Data Quality
- IVP30 (IV Percentile) had 68% raw data coverage because the API returns rows for weekends and holidays where this field is null (other fields are forward-filled). After filtering to actual trading days, coverage was 97%+.
- Duplicate tickers: Some tickers (e.g., DG — Dollar General) returned two rows per date in the API with different values, likely due to corporate actions creating multiple stock IDs. We kept the row with the higher IVX30 value (matching the website display).
Weekend/Holiday Handling
The raw API data includes entries for all calendar dates (1,802 days over 5 years). We identified 1,258 actual trading days by filtering to weekdays where at least 200 stocks had non-null IVP30 values. Forward returns were computed using a trading-day index (so "20-day forward" means 20 actual trading days, not calendar days).
Statistical Tests
- Welch's t-test: Tests whether the mean return of signal stocks differs from the mean return of all stocks. Assumes approximately normal distributions. With 6,000+ signal observations and 600,000+ baseline observations, the Central Limit Theorem provides reasonable normality of means even though individual returns are fat-tailed.
- Mann-Whitney U (Wilcoxon rank-sum): Non-parametric test. Makes no distributional assumptions. Tests whether signal returns tend to be higher or lower than baseline returns by comparing ranks.
- Bootstrap confidence interval: Resamples signal returns with replacement 10,000 times. Computes the 2.5th and 97.5th percentile of the mean difference. If the interval excludes zero, the effect is significant at 95% confidence.
Baseline Definition
The baseline is the average forward return of all S&P 500 stocks for each year separately. This is important because a stock gaining +2% in a month where the average stock gained +3% is actually underperforming. Annual baseline reset prevents multi-year market trends from contaminating the comparison.
10. Backtest Validation: Trading the IV/HV Ratio Signal
The statistical study above established that stocks with the highest IV/HV ratios underperform by -0.29% at 20 days and -0.72% at 30 days. We now test whether this edge is tradeable by running a full 5-year backtest (Feb 2021 – Dec 2025) using realistic option and stock strategies with actual market data — real bid/ask spreads, open interest filters, and intraday stop-loss monitoring.
Methodology
The backtest was built using the IVolatility backtesting framework with the following pipeline:
- Signal generation: Each trading day, rank all S&P 500 stocks by IVX30/HV20 ratio and select the top 5. This produces ~1,220 signal days x 5 names = ~6,100 signal events over 5 years.
- Option selection: For each signal, find the best ATM option (call or put) with: DTE 20–60 days, open interest ≥ 1,000, bid-ask spread ≤ 30%, |delta| ≤ 0.55. Select the contract with the highest OI. Of 313 unique symbols flagged, 209 (67%) had options meeting these liquidity filters.
- Execution: Enter at mid-price on signal day. Hold for 20 or 30 calendar days. Exit at mid-price on the exit date.
- Stop-loss: Earnings-style — dormant during the holding period, activates only on the exit date. Baseline resets to the 9:30 AM bar on the exit day, monitored at 1-minute intervals.
- Position sizing: 10% of $100K capital per trade. Option margin calculated at 20% of underlying (naked option margin).
- Walk-forward design: Run in yearly batches (2021, 2022, 2023, 2024, 2025) to avoid look-ahead bias. Each batch uses only signals generated within that year's date range.
Two strategies were tested independently:
| Strategy | Position | Thesis | Entry | Exit |
|---|---|---|---|---|
| SHORT_OPTION | Sell naked ATM option | Capture IV crush — options are overpriced relative to realized vol | IV/HV ratio in daily top 5 | Hold 20 or 30 days + SL on exit day |
| SHORT_STOCK | Short stock shares | Direct underperformance play — stock price should decline | IV/HV ratio in daily top 5 | Hold 20 or 30 days + SL on exit day |
Optimization Grid
Six parameter combinations were tested per symbol:
| Combo | Hold Days | Stop-Loss | Description |
|---|---|---|---|
| cb1 | 20 | None | Baseline, 20-day hold |
| cb2 | 20 | PL 10% | Tight SL on exit day |
| cb3 | 20 | PL 40% | Loose SL on exit day |
| cb4 | 30 | None | Baseline, 30-day hold |
| cb5 | 30 | PL 10% | Tight SL on exit day |
| cb6 | 30 | PL 40% | Loose SL on exit day |
Short Option Strategy Results
| Combo | Trades | Win Rate | Total P&L | Avg Win | Avg Loss | Profit Factor |
|---|---|---|---|---|---|---|
| 20d Baseline | 547 | 67.1% | -$129,532 | +69.2% | -213.5% | 0.70 |
| 20d PL10 | 374 | 64.7% | -$97,440 | +68.2% | -219.4% | 0.68 |
| 20d PL40 | 374 | 64.7% | -$97,440 | +68.2% | -219.4% | 0.68 |
| 30d Baseline | 405 | 73.1% | -$140 | +77.2% | -233.8% | 1.00 |
| 30d PL10 | 302 | 71.2% | +$20,568 | +76.5% | -229.1% | 1.10 |
| 30d PL40 | 302 | 71.2% | +$20,568 | +76.5% | -229.1% | 1.10 |
The 30-day hold period decisively outperforms the 20-day, consistent with the statistical study's finding that the IV/HV effect strengthens from 20d (-0.29%) to 30d (-0.72%). At 30 days with a tight stop-loss, the strategy generates a modest profit (+$20,568 on $100K capital over 5 years, PF 1.10).
The fundamental challenge is asymmetric risk: the average winning option trade earns +77% of premium collected, but the average loser costs -234% of premium. A single catastrophic move (e.g., APP +1,740%, TSLA +1,266%) can wipe out dozens of winners. The median trade is profitable (+74% for 30d), but the mean is dragged negative by tail losses.
Short Option Results by Year
| Year | 30d Baseline (cb4) | 30d + SL (cb5) |
|---|---|---|
| 2021 | 81 trades, 72.8% WR, -$11,642 | 65 trades, 70.8% WR, -$10,846 |
| 2022 | 90 trades, 78.9% WR, +$25,051 | 63 trades, 76.2% WR, +$14,320 |
| 2023 | 81 trades, 74.1% WR, +$26,029 | 64 trades, 75.0% WR, +$30,421 |
| 2024 | 71 trades, 64.8% WR, -$35,224 | 52 trades, 61.5% WR, -$27,046 |
| 2025 | 82 trades, 73.2% WR, -$4,354 | 58 trades, 70.7% WR, +$13,719 |
The strategy was profitable in 2022 (bear market — elevated IV provided rich premium) and 2023 (recovery — IV crush as volatility normalized). It lost in 2024 due to several large tail-risk events in AI and tech stocks.
Short Stock Strategy Results
| Combo | Trades | Win Rate | Total P&L | Avg Win | Avg Loss | Profit Factor |
|---|---|---|---|---|---|---|
| 20d Baseline | 1,122 | 43.3% | -$139,540 | +6.5% | -7.1% | 0.69 |
| 30d Baseline | 1,034 | 46.0% | -$154,310 | +7.3% | -9.0% | 0.69 |
| 30d PL10 | 1,034 | 46.0% | -$153,760 | +7.3% | -9.0% | 0.69 |
The short stock strategy consistently loses money. The win rate never exceeds 52.4% (2022 bear market), and even then the P&L barely turned positive (+$5,901). Stop-loss is essentially irrelevant — PL10 and PL40 produce nearly identical results because the exit-day-only SL rarely triggers on intraday moves from the 9:30 bar.
| Year | 20d Stock | 30d Stock | Market |
|---|---|---|---|
| 2021 | -$60,351 (37.3% WR) | -$61,767 (39.7% WR) | Bull +27% |
| 2022 | +$5,901 (52.4% WR) | -$4,138 (52.3% WR) | Bear -19% |
| 2023 | -$49,463 (37.5% WR) | -$47,681 (45.2% WR) | Recovery +24% |
| 2024 | -$31,134 (39.4% WR) | -$35,318 (48.4% WR) | Bull +23% |
| 2025 | -$4,493 (46.3% WR) | -$5,407 (44.2% WR) | Volatile +5% |
The short stock results confirm the statistical study's caveat: the -0.29% underperformance at 20 days is real but too small to trade profitably as a directional bet. The effect size does not overcome transaction costs, bid-ask slippage, and the inherent difficulty of shorting into a structurally bullish market (S&P 500 rose ~74% over the 5-year period).
Key Findings
1. The IV/HV signal has a real but modest options edge. Selling naked ATM options on high-IV/HV stocks with a 30-day hold breaks even (PF 1.00) without stop-loss and earns a slight profit (PF 1.10) with stop-loss. The signal is not strong enough for a standalone strategy but could serve as a filter within a broader options-selling framework.
2. Naked short options have extreme tail risk. The worst single trade (APP, Oct 2024) lost $38,640 — equivalent to 39 average winning trades. This is the core problem: the strategy wins often (73%) but the rare catastrophic loss is 3× larger than the average win. Position sizing and portfolio diversification are essential.
3. Stop-loss has minimal impact with exit-day-only activation. Because the SL only activates on the final day (earnings-style), it catches very few losses. Intraday moves from the 9:30 bar on day 30 rarely exceed 10-40% of option premium. A more aggressive SL (active throughout the hold) would cut more losses but also kill winning trades that dip temporarily.
4. The signal is overwhelmingly non-earnings. Only 9.2% of signals fire near earnings dates (1.5% on the earnings day, 7.4% in the days before). The remaining 82.5% capture structural IV/HV mispricing on normal trading days. This is important: the edge is not simply "sell premium before earnings."
5. Call options dominate due to liquidity. 61% of trades are calls vs 39% puts, driven by the OI ≥ 1,000 filter. S&P 500 stocks tend to have higher call OI, especially at ATM strikes. This creates a natural short-call bias, which explains some of the losses in strong bull years (2021, 2024) when short calls face unlimited upside risk.
6. Short stock is not viable. Despite the statistically significant -0.29% underperformance, the directional strategy loses money every year except the 2022 bear market. The effect size is too small relative to the structural upward drift of equities.
Comparison with SPY Backtest (Part II)
The SPY Z-score backtest (Section 10 of Part II) found the opposite result — a highly profitable straddle strategy:
| Metric | SPY Straddle (Z-score) | Individual Stock Short Option (IV/HV) |
|---|---|---|
| Signal | IVX30 Z-score spike on SPY | IV/HV ratio top-5 individual stocks |
| Trades | 26 (5 years) | 405 (5 years, 30d baseline) |
| Win Rate | 76.9% | 73.1% |
| Profit Factor | 8.43 | 1.00 |
| Total Return | +61.24% | -$140 (~0%) |
| Max Drawdown | -2.27% | N/A |
| Avg Hold | 15.5 days | 36 days |
The SPY strategy outperforms dramatically for three reasons: (1) SPY is a diversified index — individual stock tail risk is eliminated; (2) the Z-score signal on SPY fires only ~26 times in 5 years (high conviction), while IV/HV ratio on individual stocks fires daily (low conviction per trade); (3) SPY straddle captures both calls and puts symmetrically, while individual stocks face asymmetric OI-driven selection.
This comparison illustrates an important principle: a statistically significant signal does not automatically translate into a profitable strategy. The -0.29% cross-sectional underperformance effect is real and replicable, but the practical challenges of trading it on individual names — tail risk, liquidity filters, call/put asymmetry, and the small effect size — erode the theoretical edge. The same type of signal applied to SPY, where these frictions are minimal, produces a dramatically different outcome.
11. Data and Reproducibility
This study uses data from the IVolatility.com API. Two endpoints were used:
-
/equities/stock-market-datawithstockGroup=SP500_STOCKS— provides pre-computed daily values for IVX30, IVX60, HV10, HV20, HV30, IVX30/HV20 ratio, IVR30, and IVP30 for all S&P 500 constituents. -
/equities/eod/ivx— provides the Implied Volatility Index at shorter terms (7, 14, 21 calendar days) per individual symbol. This endpoint was called for each of the 520 S&P 500 tickers to obtain IVX7, IVX14, and IVX21 for the ratio term structure analysis (Section 7).
Study parameters:
- Date range: February 24, 2021 – February 23, 2026 (data fetch), signals through December 31, 2025
- Selection: Top 5 stocks daily per indicator/ratio
- Forward horizons: 1, 3, 5, 7, 10, 20, 30 trading days
- Part I (indicator comparison): 6,100 events per indicator (24,400 total across 4 indicators)
- Part II (ratio term structure): 6,100 events per ratio (30,500 total across 5 ratios)
- Statistical tests: Welch's t-test, Mann-Whitney U, Bootstrap (10,000 resamples)
- Composite scoring: 40% average excess return, 30% significance breadth, 30% year consistency
The complete analysis code, DuckDB databases, and chart generation scripts are available for reproducibility.
Disclaimer: This study is for informational and educational purposes only and does not constitute investment advice, a recommendation, or a solicitation to buy, sell, or hold any security, option, or financial instrument. Past performance and statistical findings do not guarantee future results. Options trading involves significant risk, including the potential for losses exceeding the initial investment. Always conduct your own due diligence and consult a qualified financial advisor before making any investment decisions.
Research and backtesting by IVOLAI. Analysis conducted using IVolatility.com data and API. All implied volatility indicators (IVX, IVR, IVP, HV) are pre-computed by IVolatility. The IVX is calculated using a proprietary weighting technique factoring Delta and Vega of each option, using 8 ATM options (4 calls, 4 puts) per expiration, normalized to fixed tenors of 7, 14, 21, 30, 60, 90, 120, 150, 180, 270, 360, 720, and 1080 days.
IVolAI is currently in the final stage of testing. Please stay tuned for updates on when it becomes available.