A Correction in Equities is Forming
April 11, 2024
The Markets at a Glance
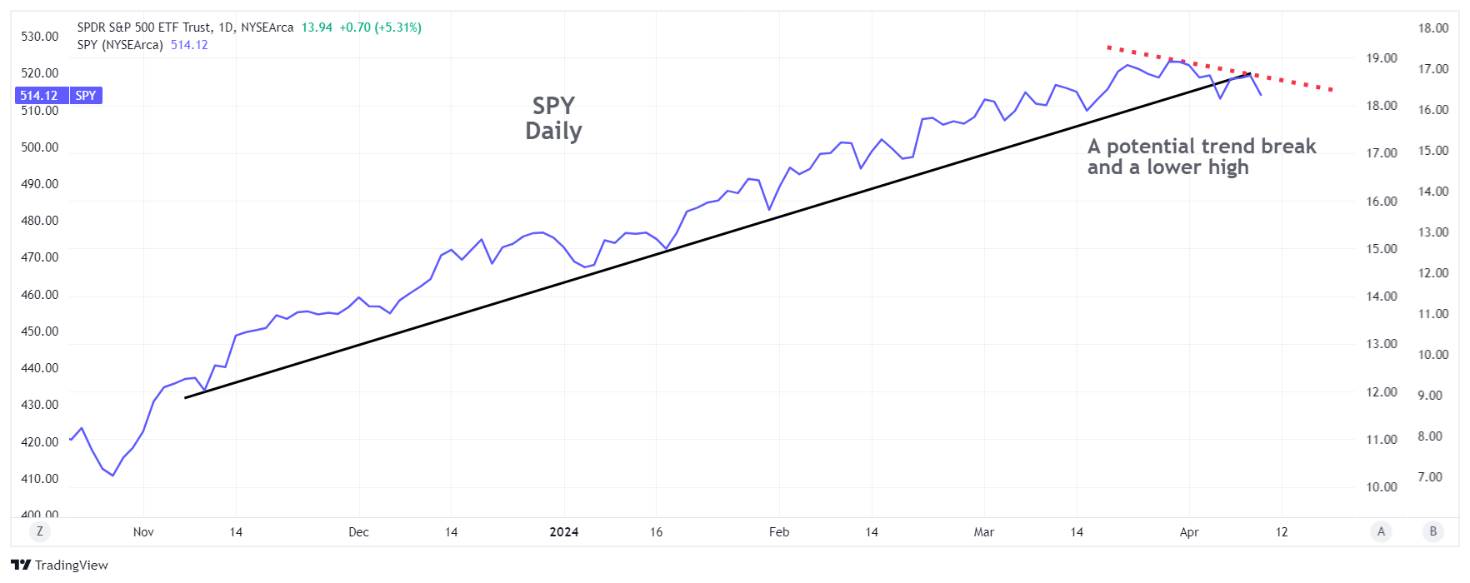
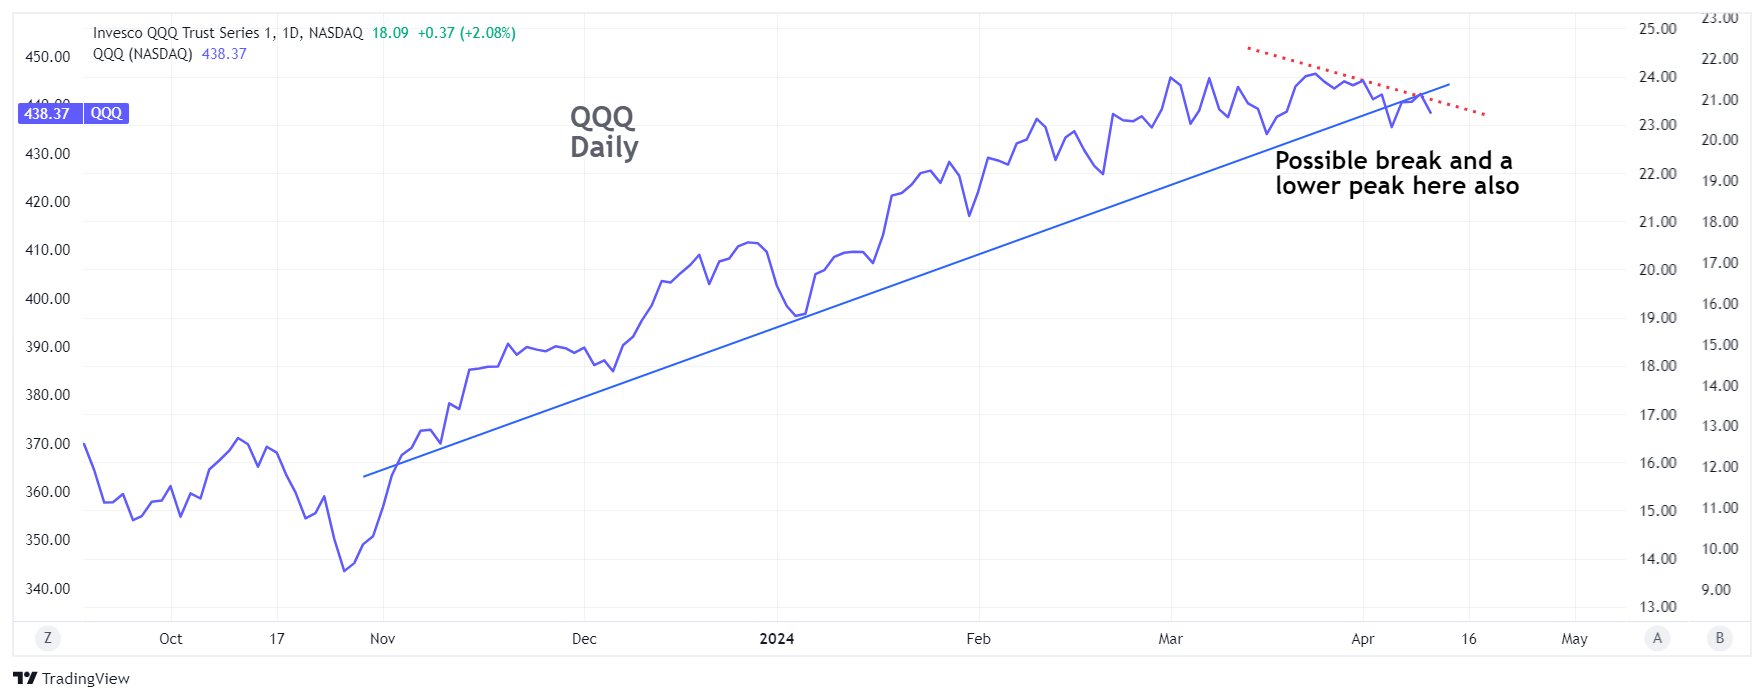
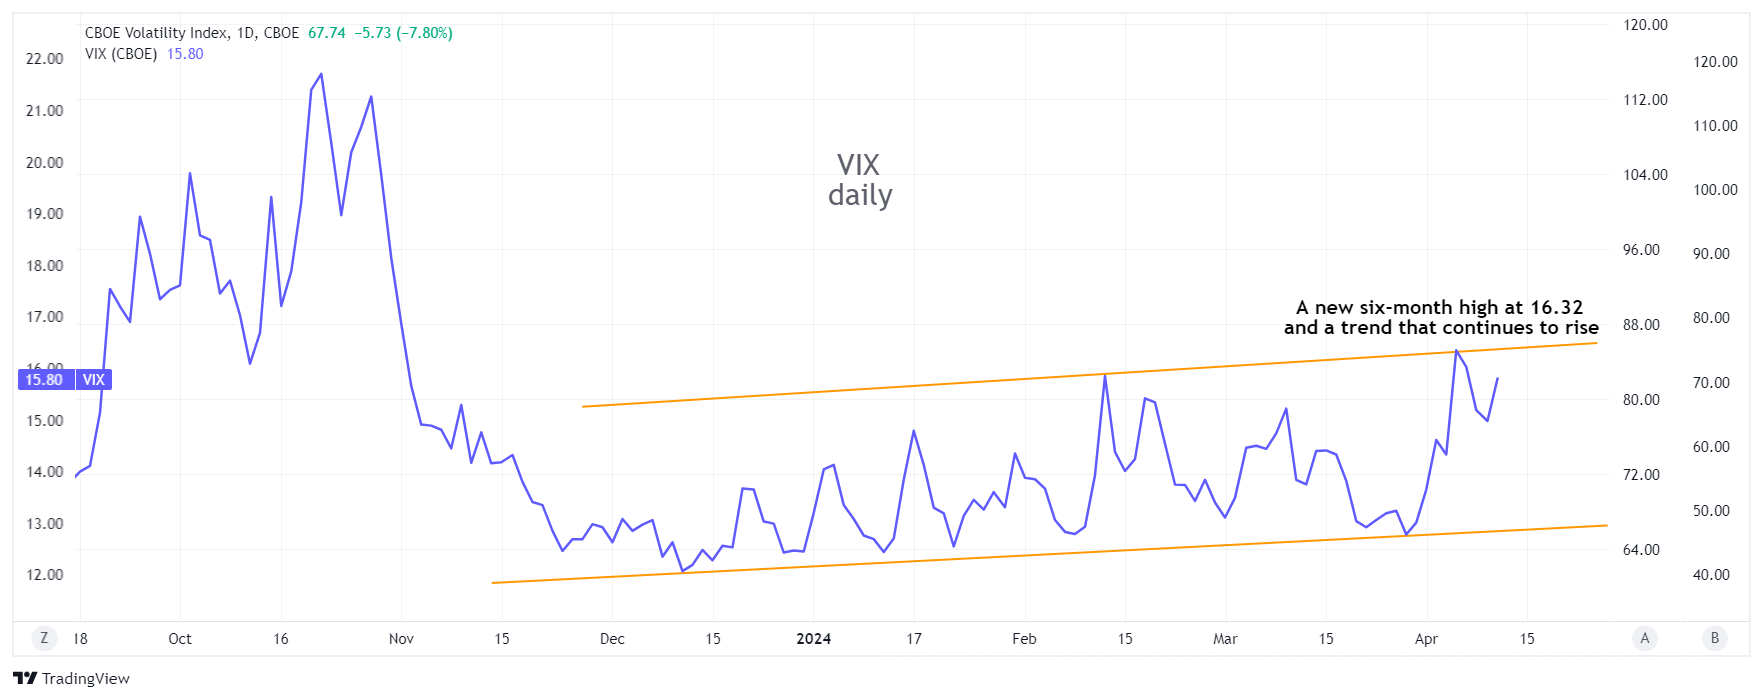
An Early Appraisal Says The Trend May Now Be Breaking
Depending on where you draw your trendlines, a case can now be made for both SPY and QQQ beginning to break their six-month uptrends. This is confirmed by a VIX that has been steadily rising so far this year and topped 16 for the first time this year.
Other observations suggest a move into defensive issues like gold and US Treasuries also supports the notion that investors have taken a cautious turn. Momentum being what it is, the selling that has occurred so far may have to play itself out. There is no way to tell, however, whether there will be a sharp, quick sell-off or just a continuation of lower highs, leading to a relatively modest correction. Earnings reports for the first quarter will be coming out soon and that could determine how deep or shallow a correction might ensue.
Strategy talk: Option Strategies For A Modest Correction in SPY or QQQ
As I discussed in last week's letter, straight put purchases are not an optimal way to play a decline in a major index unless you have reason to believe it might fall off a cliff. A more modest decline (with the inevitable bounces in between) requires a different approach. Thus far, SPY has dropped a little over 2% in a week and a half since the recent peak at 524.61. It did have a drop of more than that in a single day last week, but unless you timed that move perfectly with a long put and closed out quickly, you would have seen your profits almost completely evaporate over the next day and a half as the market bounced back up.
To play a modest correction that might last a month or more, while containing unpredictable retracements, a diagonal spread for that time period would be more appropriate. And if you are indeed going to play a potential decline over that length of time, you should take a long put position at least that far ahead and use an ITM option to reduce time decay. A May 530 put, for example, has about 35 days till expiration and closed on Wednesday at around $17.30. That's only around $1.40 of time value.
Then, you can begin writing shorter term OTM puts against that May 30 to create diagonals. You'll have as many as 20 daily expirations before May's monthly expiration, which will give you the flexibility to sell short term puts and roll your strikes as the market slides and recovers, capturing a ton of aggregate time value in the process. That way, you don't need to be right on every possible short term move in the index. You'd be profiting instead on the general decline over 5 weeks and all the time value you would capture along with it.
You can make most of your gains from time value if you write ATM puts against your longer May 30 position, or you can write further out-of-the-moneys to profit from steeper declines. Either way, as long as you are writing puts at a strike of 513 or lower, you will be in good shape to build profits as the market declines.
I think of diagonals essentially as leveraged covered writes, using either puts or calls. Once you realize they can profit from both time and direction (along with a possible increase in implied volatility), you'll likely get hooked.
Got a question or a comment?
We're here to serve iVol users and we welcome your questions or feedback about the option strategies discussed in this newsletter. If there is something you would like us to address, we're always open to your suggestions. Use rhlehman@ivolatility.com.
Previous issues are located under the News tab on our website.